


There are LOTS of reversal candlestick patterns which you can use to trade the Stock market. That’s a fact.
And here’s the second fact: the more reversal candlesticks you have to learn to apply to trade, the more confusing your trading becomes.
So the real question is: do you really need to study and know every reversal bars, reversal candlesticks, reversal chart pattern etc to be a successful forex trader?
Short answer in my honest and humblest opinion: I don’t think so…no.
In here, I’m going to show you 10 candlestick patterns here, which are commonly occurring on the forex charts everyday in all timeframes. These can be easily incorporated in most Stock trading strategies as a buy or sell signal.
Candlestick Patterns Are Classified Into Two Main Groups, Bearish Candlestick Patterns or Bullish Candlestick Patterns.
Let’s get started first with the bearish reversal bar (candlestick patterns).
5 BEARISH REVERSAL CANDLESTICK PATTERNS
#1: Bearish Engulfing Candlestick Pattern
A bearish engulfing candlestick pattern is a 2 candlestick formation pattern. As the names says, this is a bearish signal.
The first candlestick is a bullish candlestick and the second candlestick is bearish but overshadows the the first bullish candlestick.
An example is shown below.

Where Bearish Engulfing Patterns Form On A Chart
Bearish engulfing patterns can form in any timeframe from the 1 minute up the the monthly timeframe but it really does matter where this bearish engulfing pattern forms…
So in an uptrend, when price is heading up, you need to be aware of:
- resistance levels,
- a downward trendlines
- or a fib retracement level
- or a confluence of all the above 3.
These are the important spots or levels you should keep an eye out for the bearish engulfing pattern. Remember, this is a sell/bearish signal.
Personally, I don’t like to trade any bearish engulfing pattern that forms anywhere except based on the 4 conditions given above.
This applies to all the bearish reversal candlestick patterns I’m going to show you here in the next few pages.
#2: Shooting Star Candlestick Pattern(Bearish Pin Bar)
Don’t get confused…a shooting star is a bearish pin bar (or a bearish pin bar is a shooting star) as long as this candlestick forms in an uptrend.
A shooting star is a single candlestick pattern and the thing that makes this candlestick the most easiest of all reversal candlesticks to identify is this: it looks like a pin as shown below.

Where Shooting Star /Pin Bar Patterns Form On A Chart
Look for shooting stars/bearish pin bars on:
- resistance levels
- downward trendline touches
- fib retracement levels
- or a confluence of any of the above.
#3: Bearish Harami Candlestick Pattern
A bearish harami candlestick pattern is a 2 candlestick pattern formation.
The first candlestick is a bullish candlestick. The second candlestick is a bearish candlestick that forms inside the shadow of the first bullish candlestick…in other words, the 2nd candlestick is an inside bar.
Here’s how it looks:

Where Bearish Harami Candlestick Patterns Form On A Chart
As the same with other bearish reversal candlestick patterns, you should be keeping an eye out for this candlestick pattern on:
- resistance levels
- downward trendline touches
- fib retracement levels
- or a confluence of any of the above.
#4: Dark Cloud Cover Candlestick Pattern
The dark cloud cover candlestick pattern is a 2 candlestick pattern formation.
The first candlestick is a bullish candlestick. The second candlestick is a bearish candlestick. But here’s the thing with the second bearish candlestick: it has to at least close 50% below the previous period’s price range.
The fact that the 2nd bearish candlestick closes more than 50 % below the first bullish candlestick means that bears have now taking control and the trend is most likely to head down.
Here’s what a dark cloud cover candlestick pattern looks like:

Where Dark Cloud Cover Patterns Form On A Chart
Look for dark cloud cover patterns on:
- resistance levels
- downward trendline touches
- fib retracement levels
#5: Doji Candlestick
A doji candlestick can both be a bearish signal or a bullish signal. The secret to trading the doji candlestick is understanding where it formed.
For example, if you see a doji candlestick form in a major resistance level, the breakout of the low of that doji candlestick means that the market has a greater probability of heading down. So in this context, it should be a sell signal.
A doji candlestick is a single candlestick pattern. It generally tends to be a very short candlestick, with little to no body at all.
The doji candlestick simply shows a period of indecision where traders are most likely sitting on the sidelines not really wanting to trade and watching and waiting to see which way price moves before taking sides.
Here’s what a doji candlestick looks likes on a chart…notice that price was in an uptrend and after the doji candlestick formed, it changed to a downtrend:

Where Doji Candlestick Patterns Form On A Chart
Look for doji candlestick patterns on:
- resistance levels
- downward trendline touches
- fib retracement levels
5 BULLISH REVERSAL CANDLESTICK PATTERNS
On these next few pages, you are going to learn about the next 5 Bullish reversal candlestick patterns.
So what are bullish reversal candlestick patterns? Well, they are candlestick patterns where if they form, they indicate that the market is may turn from a downtrend to an uptrend.
For my case, I’d like to see bullish reversal candlesticks in a downtrend form on these price levels:
- major support levels
- upward trendline bounces
- fib retracement levels
These bullish reversal candlesticks can be easily incorporated into your forex trading strategies as buy signals or buy signal confirmation.
#6: Bullish Engulfing Candlestick Pattern
The Bullish Engulfing pattern is the exact opposite of a bearish engulfing pattern.
With the bullish engulfing pattern, what you have is a 2 candlestick formation where the first candlestick is a bearish candlestick that hides in the shadow of the second candlestick which is bullish.
And it looks like this:

Where Bullish Engulfing Patterns Form On A Chart
Look for Bullish engulfing patterns when price is near or touching these levels:
- major support levels
- upward trendline bounces
- fib retracement levels
#7: Bullish Hammer Candlestick Pattern
The bullish hammer candlestick pattern can also be called a bullish pin bar. It is the exact opposite of a shooting start candlestick pattern (or bearish pin bar).
The bullish hammer candlestick pattern is a single candlestick formation and it is very easy to spot as this candlestick tends to be very long and looks like a pin bar or hammer.
Here’s how a bullish hammer candlestick looks like:

Where Bullish Hammer Patterns Form On A Chart
Look for Bullish hammer reversal candlestick patterns when price is near or touching these levels:
- major support levels
- upward trendline bounces
- fib retracement levels
#8: Bullish Harami Reversal Candlestick Pattern
The bullish harami reversal candlestick pattern is a 2 candlestick pattern formation.
It is the exact apposite of the bearish harami reversal candlestick pattern.
Ok, with the bullish harami candlestick pattern, the first candlestick is a bearish candlestick and the second candlestick is a bullish candlestick but guess what?
The second candlestick is quite short and hides inside the shadow of the first bearish candlestick.
Here’s and example of a bullish harami pattern:

Where Bullish Harami Candlestick Patterns Form On A Chart
Look for Bullish harami reversal candlestick patterns when price is near or touching these levels:
- major support levels
- upward trendline bounces
- fib retracement levels
#9: Piercing Line Candlestick Pattern
The piercing line candlestick pattern formation is a 2 candlestick pattern formation.
The first candlestick is bearish and the second candlestick is bullish.
Make sure that the close of the 2nd bullish candlestick is more than 50% of the first bearish candlestick length.

Example of Piercing Line Pattern Trading
Here’s a chart showing how after the formation of piercing line pattern in a downtrend, the market changed to an uptrend:

Where Bullish Piercing Candlestick Patterns Form On A Chart
Look for piercing line candlestick patterns when price is near or touching these levels:
- major support levels
- upward trendline bounces
- fib retracement levels
#10: Doji Candlestick Pattern
Remember I said in the beginning that a doji candlestick pattern can go both ways and it really depends a lot on where the doji candlestick forms?
Well, in that context, the doji candlestick can be a bullish reversal candlestick when it is formed in a downtrend.
As you should know by now, the doji candlestick is a single candlestick pattern.
It tends to be a very short candlestick with little to no body at all. This shows a period of indecision.
On the chart below, note that the 2nd doji candlestick forms on a support level and the breakout of its high saw price going up in an uptrend:

Where Doji Candlestick Patterns Form On A Chart
Look for doji candlestick patterns when price is near or touching these levels:
- major support levels
- upward trendline bounces
- fib retracement levels
Summary Of Reversal Bars & Reversal Candlesticks
I have covered 5 bearish engulfing patterns and they are:
- bearish engulfing
- shooting star/or bearish pin bar
- bearish harami candlestick pattern
- the dark cloud cover candlestick pattern
- and the doji candlestick pattern
Here’s what they look like just to refresh you memory again:
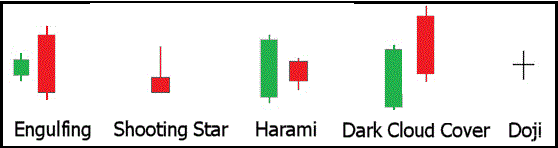
I also covered 5 bullish reversal candlestick patterns patterns and they are:
- bullish engulfing reversal pattern
- bullish hammer/ bullish pin bar pattern
- bullish harami candlestick pattern
- piercing line candlestick pattern
- and the doji candlestick pattern
Here’s what they look like:

Don’t forget to share and tweet if you’ve enjoyed this post. Thanks.


🏌♂Price action Trading Course🎯
ReplyDelete💸Fees:₹25K, ⏱Duration :1week
---------------------------------------------------
🌎Market Global trend & Indian Market trend
⚡️Global tricks strategy (Live scanner/EOD Scanner)
🗼Pre-market Scrip Selection(EOD Scanner)
💻Live Market scrip Section(Live Scanner)
🕘Day trading strategy(Live Scanner)
🛡Positional Trading strategy (EOD/Live Scanner)
---------------------------------------------------
Contact Us: +91-9953573304 for Learning price action trading Cource
Oh my lord! There is so much to learn. I have just applied for a course in financial planning because it seems like people are getting more inclined towards investments and insurances. It is my brother who keeps sharing topics from this website with me. Last week, he shared some good information on Balance Advantage funds and found it very useful.
ReplyDelete