Recent

3/recentposts

Popular Posts

Theme images by Storman. Powered by Blogger.

Sample Text

Pages

Unordered List

Recent in Sports

4/Sports/custom-widget

Home Ads

Home Ads

Tags

#1 Live Trading on Glenmark Pharmaceuticals Ltd #1 Live Trading on Godrej Industries Limited #3 Live Trading Session 1-2-3 Strategy 1-2-3-4 Reversal Trading Strategy 10 CHART PATTERNS FOR PRICE ACTION TRADING 10 Habits of successful traders 10 Performing Candlesticks 10 PRICE ACTION BAR PATTERNS YOU MUST KNOW 10 PRICE ACTION CANDLESTICK PATTERNS YOU MUST KNOW 10 Things You Can Learn From The World’s Best Traders 10 TYPES OF PRICE CHARTS FOR TRADING 123 forex trading strategy 123 Trading Strategy 200 SMA 3 Bar Net Line Strategy 6 Best Price Action Trading Strategies 7 RSI TRADING STRATEGIES 9 Advanced & Profitable Trading Strategy 9 Funny Facial Expressions AB = CD Price Action Strategy Abb India Limited Aditya Birla Nuvo Limited Aditya Birla Nuvo Ltd ADVANCED REVERSAL STRATEGY Alice Blue Opening Link Alphabets Amaraja Battries Ambuja Cement Anupam Rasayan India Limited IPO Asian Paint Ltd Aurobindo Pharma Limited Bajaj-Auto Bearish Crossover Bearish Engulfing Bearish Engulfing Candle Bearish Reversal (Red-Red) BEML Ltd Best Stock Market Strategy Bharat Finance Inclusion Blood Rain Pattern bollinger band Bollinger Band Price goes below Mid line Strategy Bollinger Band Price gone above mid line Bollinger Band Strategy Breakout Stock Trading Strategy Bullish Crossover Bullish Engulfing Bullish Gartley Pattern Strategy Bullish Three Bar Reversal Butterfly Spread Cadila Healthcare Limited Calendar Spread Camarilla Equition canara Bank Candlestick Charts Candlestick Patterns Candlestick Patterns Strategy Cesc Limited Chart Patterns Cipla Closing Above Previous High for 3 Days Closing Below Previous Low For 3 Days coal India Cup & Handle Pattern Daily Life of a Trader dark cloud cover Day Trading Breakout Day Trading Setups Day Trading Setups – 6 Classic Formations Day Trading Strategy DBLHC Descending Triangle Divergence Price Action Strategy DIVI'S Laboratories Ltd Doji Candlestick Patterns Dojis Double EMA Dr Reddy Dr. Reddy's Laboratories Limited Early Morning Range Breakouts – 4 Trading Strategies EMA Equity Market EXHAUSTION BAR Falling Wedges (26th Dec 2017) Federal Bank fibonacci Fibonacci Retracement Fibonacci Retrenchment Strategy Fibonacci swing trading strategy Flag Pattern Strategy Flash Pattern Forex Trading Strategies Fyers Account Gandhi Jayanti Gap Up Gartley Pattern Glenmark Pharmaceuticals Limited godrej Godrej Consumer Products Limited Godrej India Gppl Happy Birthday Happy Chhath Puja Happy Diwali Happy Diwali (2017) Happy Diwali (2018) Happy Dussehra Happy Ganesh Chaturthi Happy Holi Happy Independence Day 2017 Happy Janmashtami Happy Krishna Janmashtami 2017 Happy Muharram 2017 Happy Navratri To All Happy Teacher Day Harmonic Pattern HCL Technology HDFC HDFC Bank Head & Shoulders breakout Head & Shoulders Pattern (6th Oct 2017) Head and Shoulders Pattern Higher high of 3 days Hikkake Pattern Hindustan Petrolium Hindustan Unilever Hindustan Unilever Limited HOW TO DRAW TRENDLINES How To Trade Supply And Demand IndusInd Bank Indusind Bank Ltd Infosys INSIDE BAR Inside Bar - Outside Bar Inside Bar Trading Strategy by Stock Alphabets Inside Day Bar Intraday Intraday strategy Intraday strategy with Camarilla Equition intraday SureShot Intraday SureShot Official Post Intraday Trading Strategy Intraday/Day Trading Strategy inverted Head & Shoulders Irb Infrastructure Developers Limited Iron Condor Iron Fly Island Reversal Pattern Trading Strategy Jindal Steel & Power Limited Jk Lakshmi Cement Limited Jubilant Food Jubilant Foodworks Limited Kajaria Ceramics KEY REVERSAL BAR Kingfa Science and Technolgy (India) Ltd Kotak Mahindra Bank Limited Larson & Tarbo LIC LIC Housing Finance Limited Live Trading Lupin Limited M & M Finance Mahanagar gas Making Higher High for 3 Days Making Lower Lows for 3 Days Master Candle Master Candle Strategy Master Plus Candlesticks Meditation Mind Tree Mindtree Mobile App & Website for share market Momentum Divergence Strategy Morning and Evening Stars Moving Average Strategy My 10 price action secrets Naked Options NBCC (India) Limited New Mobile Application Annoucement NHPC Nifty Trend (12th August 2017) Nifty Trend line (10th August 2017) NMDC NMDC Cup & Handle Pattern NR7 NTPC Nureca Limited IPO Option Strangle (Long Strangle) Options Strategy Newsletter OUTSIDE BAR Outside Bar-Inside Bar Combo Pattern Pattern Strategy PATTERNS Pidilite India PINOCCHIO BAR (PIN BAR) PINOCCHIO BAR TRADE SETUP (PIN BAR) Piramal Enterprises Limited planting trees PNB POPGUN BAR PATTERN Price action Price Action Candlestick Patterns Price Action Continuation Patterns Price Action PATTERN # 6: Pin Bars PRICE ACTION PATTERN #1: DBLHC Price Action PATTERN #4: BEOVB Price Action PATTERN #5: BUOVB Price Action Patterns Price Action Pivot Point Strategy Price Action Sandwich Trading Setup Price Action Strategy Price Action Strategy Guide Price Action Strategy lover Price Action Trading Class Price Action Trading Course Price action trading strategy Price came back channel from bottom Price came back channel from Top Price gone below mid line Price-action-trading-strategies #Chapter-01 Price-action-trading-strategies-#Chapter-02 price-action-trading-strategies-#Chapter-03 Price-action-trading-strategies-#chapter-04 Profitable Level Profitable Level (13th Dec 2017) Profitable Level (14th Dec 2017) Profitable Level (15th Dec 2017) Profitable Level (18th Dec 2017) Profitable Level (18th Sept 2017) Profitable Pattern Profitable Trader Profitable Traders Do Nothing 99% Of the Time PVR RailTel IPO Ratio Spread Raymond Limited Reliance Capital Reliance Infra Repco Home Finance REVERSAL BAR PATTERN Risk/Reward Ross Hook Pattern Trading Strategy RSI RSI Divergence Strategy SBI Shooting Six Candle Concepts SMA Sodha Spring at Support & Resistance State Bank of India Stock Alphabets Stock Market Stock Market & Finance Movies Stock Market Strategy StockAlphabets Stop Loss Order Straddle Strangle Strategy EMA Strategy Resource Strip/ Strap sun Pharma Sun Pharmaceuticals Industries Limited Supertrend Supertrend Strategy support & Resistance Support & Resistance (25th Sept 2017) Support & Resistance (26th Dec 2017) Support & Resistance Strategy (6th Dec 2017) Support and Resistance Swerve pattern Swing Trading Strategies Swing Trading Strategy Tata Chemical Tata Global Beverages Tata Motors TCS The Best Stocks to Buy Now or Whenever The India Cements Limited The Outside Bar Trading Strategy Three Bar Reversal Three Candle Formation THREE-BAR PULLBACK Titan Company Limited Top Indian Companies with Monopoly Top 10 Continuation Candlesticks TOP 10 PRICE ACTION TRADING BOOKS Top 10 Reversal Candlesticks Top Monopoly stocks in India Torrent Torrent Pharmaceuticals Traders Trick Entry Trading System trading breakout Trading Key Reversal Bar Trading Psychology Trading Strategy Trading Strategy For Posstional & Intraday Trading System Trading the trend Trend line (25th Sept 2017) Trend line Strategy Trend line Strategy (14th Dec 2017) Trend Trading Analysis Prediction Trend-line Strategy (30th Nov 2017) Trendline Trendline (19th Sept 2017) Trendline (6th Nov 2017) Trendline Line Strategy Trendline strategy Trendline Strategy (19th Dec 2017) Trendline Strategy (2nd Dec 2017) Trendline Strategy (6th Dec 2017) Triagle Pattern TV18 Broadcast Limited TWO-BAR REVERSAL Types of Trader TYPICAL PRICE Typical Price Action Strategy ubl UBL Breakout Ujjivan Ujjivan Financial Services United Breweries Limited United Phosphorus Ltd Vertical Spread Volume Candlesticks Volume Trading Intraday Strategy W Pattern Wedge Pattern Strategy Wedges Price Action Strategy(16th Dec 2017) wedges Strategy (19th Dec 2017) Wipro Limited Wockhardt Limited Wolf Wave Strategy World’s Best Traders www.StockAlphabets.com Yes Bank Zee Entertainment Enterprises Limited Zydus Wellness

Travel

3/Travel/custom-widget

Comments

3/recentcomments

Ads

An�ncio

Latest in Sports

Sports

Random Posts

4/randomposts

Facebook

[Latest News][6]

#1 Live Trading on Glenmark Pharmaceuticals Ltd
#1 Live Trading on Godrej Industries Limited
#3 Live Trading Session
1-2-3 Strategy
1-2-3-4 Reversal Trading Strategy
10 CHART PATTERNS FOR PRICE ACTION TRADING
10 Habits of successful traders
10 Performing Candlesticks
10 PRICE ACTION BAR PATTERNS YOU MUST KNOW
10 PRICE ACTION CANDLESTICK PATTERNS YOU MUST KNOW
10 Things You Can Learn From The World’s Best Traders
10 TYPES OF PRICE CHARTS FOR TRADING
123 forex trading strategy
123 Trading Strategy
200 SMA
3 Bar Net Line Strategy
6 Best Price Action Trading Strategies
7 RSI TRADING STRATEGIES
9 Advanced & Profitable Trading Strategy
9 Funny Facial Expressions
AB = CD Price Action Strategy
Abb India Limited
Aditya Birla Nuvo Limited
Aditya Birla Nuvo Ltd
ADVANCED REVERSAL STRATEGY
Alice Blue Opening Link
Alphabets
Amaraja Battries
Ambuja Cement
Anupam Rasayan India Limited IPO
Asian Paint Ltd
Aurobindo Pharma Limited
Bajaj-Auto
Bearish Crossover
Bearish Engulfing
Bearish Engulfing Candle
Bearish Reversal (Red-Red)
BEML Ltd
Best Stock Market Strategy
Bharat Finance Inclusion
Blood Rain Pattern
bollinger band
Bollinger Band Price goes below Mid line Strategy
Bollinger Band Price gone above mid line
Bollinger Band Strategy
Breakout Stock Trading Strategy
Bullish Crossover
Bullish Engulfing
Bullish Gartley Pattern Strategy
Bullish Three Bar Reversal
Butterfly Spread
Cadila Healthcare Limited
Calendar Spread
Camarilla Equition
canara Bank
Candlestick Charts
Candlestick Patterns
Candlestick Patterns Strategy
Cesc Limited
Chart Patterns
Cipla
Closing Above Previous High for 3 Days
Closing Below Previous Low For 3 Days
coal India
Cup & Handle Pattern
Daily Life of a Trader
dark cloud cover
Day Trading Breakout
Day Trading Setups
Day Trading Setups – 6 Classic Formations
Day Trading Strategy
DBLHC
Descending Triangle
Divergence Price Action Strategy
DIVI'S Laboratories Ltd
Doji Candlestick Patterns
Dojis
Double EMA
Dr Reddy
Dr. Reddy's Laboratories Limited
Early Morning Range Breakouts – 4 Trading Strategies
EMA
Equity Market
EXHAUSTION BAR
Falling Wedges (26th Dec 2017)
Federal Bank
fibonacci
Fibonacci Retracement
Fibonacci Retrenchment Strategy
Fibonacci swing trading strategy
Flag Pattern Strategy
Flash Pattern
Forex Trading Strategies
Fyers Account
Gandhi Jayanti
Gap Up
Gartley Pattern
Glenmark Pharmaceuticals Limited
godrej
Godrej Consumer Products Limited
Godrej India
Gppl
Happy Birthday
Happy Chhath Puja
Happy Diwali
Happy Diwali (2017)
Happy Diwali (2018)
Happy Dussehra
Happy Ganesh Chaturthi
Happy Holi
Happy Independence Day 2017
Happy Janmashtami
Happy Krishna Janmashtami 2017
Happy Muharram 2017
Happy Navratri To All
Happy Teacher Day
Harmonic Pattern
HCL Technology
HDFC
HDFC Bank
Head & Shoulders breakout
Head & Shoulders Pattern (6th Oct 2017)
Head and Shoulders Pattern
Higher high of 3 days
Hikkake Pattern
Hindustan Petrolium
Hindustan Unilever
Hindustan Unilever Limited
HOW TO DRAW TRENDLINES
How To Trade Supply And Demand
IndusInd Bank
Indusind Bank Ltd
Infosys
INSIDE BAR
Inside Bar - Outside Bar
Inside Bar Trading Strategy by Stock Alphabets
Inside Day Bar
Intraday
Intraday strategy
Intraday strategy with Camarilla Equition
intraday SureShot
Intraday SureShot Official Post
Intraday Trading Strategy
Intraday/Day Trading Strategy
inverted Head & Shoulders
Irb Infrastructure Developers Limited
Iron Condor
Iron Fly
Island Reversal Pattern Trading Strategy
Jindal Steel & Power Limited
Jk Lakshmi Cement Limited
Jubilant Food
Jubilant Foodworks Limited
Kajaria Ceramics
KEY REVERSAL BAR
Kingfa Science and Technolgy (India) Ltd
Kotak Mahindra Bank Limited
Larson & Tarbo
LIC
LIC Housing Finance Limited
Live Trading
Lupin Limited
M & M Finance
Mahanagar gas
Making Higher High for 3 Days
Making Lower Lows for 3 Days
Master Candle
Master Candle Strategy
Master Plus Candlesticks
Meditation
Mind Tree
Mindtree
Mobile App & Website for share market
Momentum Divergence Strategy
Morning and Evening Stars
Moving Average Strategy
My 10 price action secrets
Naked Options
NBCC (India) Limited
New Mobile Application Annoucement
NHPC
Nifty Trend (12th August 2017)
Nifty Trend line (10th August 2017)
NMDC
NMDC Cup & Handle Pattern
NR7
NTPC
Nureca Limited IPO
Option Strangle (Long Strangle)
Options Strategy Newsletter
OUTSIDE BAR
Outside Bar-Inside Bar Combo Pattern
Pattern Strategy
PATTERNS
Pidilite India
PINOCCHIO BAR (PIN BAR)
PINOCCHIO BAR TRADE SETUP (PIN BAR)
Piramal Enterprises Limited
planting trees
PNB
POPGUN BAR PATTERN
Price action
Price Action Candlestick Patterns
Price Action Continuation Patterns
Price Action PATTERN # 6: Pin Bars
PRICE ACTION PATTERN #1: DBLHC
Price Action PATTERN #4: BEOVB
Price Action PATTERN #5: BUOVB
Price Action Patterns
Price Action Pivot Point Strategy
Price Action Sandwich Trading Setup
Price Action Strategy
Price Action Strategy Guide
Price Action Strategy lover
Price Action Trading Class
Price Action Trading Course
Price action trading strategy
Price came back channel from bottom
Price came back channel from Top
Price gone below mid line
Price-action-trading-strategies #Chapter-01
Price-action-trading-strategies-#Chapter-02
price-action-trading-strategies-#Chapter-03
Price-action-trading-strategies-#chapter-04
Profitable Level
Profitable Level (13th Dec 2017)
Profitable Level (14th Dec 2017)
Profitable Level (15th Dec 2017)
Profitable Level (18th Dec 2017)
Profitable Level (18th Sept 2017)
Profitable Pattern
Profitable Trader
Profitable Traders Do Nothing 99% Of the Time
PVR
RailTel IPO
Ratio Spread
Raymond Limited
Reliance Capital
Reliance Infra
Repco Home Finance
REVERSAL BAR PATTERN
Risk/Reward
Ross Hook Pattern Trading Strategy
RSI
RSI Divergence Strategy
SBI
Shooting
Six Candle Concepts
SMA
Sodha
Spring at Support & Resistance
State Bank of India
Stock Alphabets
Stock Market
Stock Market & Finance Movies
Stock Market Strategy
StockAlphabets
Stop Loss Order
Straddle
Strangle
Strategy EMA
Strategy Resource
Strip/ Strap
sun Pharma
Sun Pharmaceuticals Industries Limited
Supertrend
Supertrend Strategy
support & Resistance
Support & Resistance (25th Sept 2017)
Support & Resistance (26th Dec 2017)
Support & Resistance Strategy (6th Dec 2017)
Support and Resistance
Swerve pattern
Swing Trading Strategies
Swing Trading Strategy
Tata Chemical
Tata Global Beverages
Tata Motors
TCS
The Best Stocks to Buy Now or Whenever
The India Cements Limited
The Outside Bar Trading Strategy
Three Bar Reversal
Three Candle Formation
THREE-BAR PULLBACK
Titan Company Limited
Top Indian Companies with Monopoly
Top 10 Continuation Candlesticks
TOP 10 PRICE ACTION TRADING BOOKS
Top 10 Reversal Candlesticks
Top Monopoly stocks in India
Torrent
Torrent Pharmaceuticals
Traders Trick Entry Trading System
trading breakout
Trading Key Reversal Bar
Trading Psychology
Trading Strategy
Trading Strategy For Posstional & Intraday
Trading System
Trading the trend
Trend line (25th Sept 2017)
Trend line Strategy
Trend line Strategy (14th Dec 2017)
Trend Trading Analysis Prediction
Trend-line Strategy (30th Nov 2017)
Trendline
Trendline (19th Sept 2017)
Trendline (6th Nov 2017)
Trendline Line Strategy
Trendline strategy
Trendline Strategy (19th Dec 2017)
Trendline Strategy (2nd Dec 2017)
Trendline Strategy (6th Dec 2017)
Triagle Pattern
TV18 Broadcast Limited
TWO-BAR REVERSAL
Types of Trader
TYPICAL PRICE
Typical Price Action Strategy
ubl
UBL Breakout
Ujjivan
Ujjivan Financial Services
United Breweries Limited
United Phosphorus Ltd
Vertical Spread
Volume Candlesticks
Volume Trading Intraday Strategy
W Pattern
Wedge Pattern Strategy
Wedges Price Action Strategy(16th Dec 2017)
wedges Strategy (19th Dec 2017)
Wipro Limited
Wockhardt Limited
Wolf Wave Strategy
World’s Best Traders
www.StockAlphabets.com
Yes Bank
Zee Entertainment Enterprises Limited
Zydus Wellness

Thursday 11 March 2021

A List Of The Most Important Price Action Patterns

- No comments

To be a price action trader means having a deep understanding of the various different price action patterns that form in the market. The problem with these patterns, is that because there are so many of them that form in the market, knowing which ones you should take the time out to learn and which you should leave can be quite challenging. To solve this problem, I thought that today I would give you a list of what I believe to be the most important price action patterns you need to learn as a Forex trader.

As some of you reading this will probably already know, there are three basic types of pattern that can form in the market:

  • Price Action Reversal Patterns
  • Price Action Continuation Patterns
  • Price Action Candlestick Pattern

I’ll begin today’s article by first showing you what the most important price action reversal patterns are, followed by which continuation patterns you need to have knowledge on. Finally I’ll show you the two most important price action candlestick patterns you need to watch out for in the market.

I’ve also reformatted this article of important price action patterns into a PDF document, so if you would like to download it and read it at a later date you have the possibility to do so.

Price Action Reversal Patterns

  1. The Head And Shoulders Pattern
  2. The Double Bottom And Double Top Pattern
  3. The Rising And Falling Wedge Pattern

Reversal patterns are probably the most important set of price action patterns you need to really have a deep understanding of, as they can give you early clues about if a movement in the market is coming to an end. The six patterns I’m going to be showing you in this section are all multi-swing shape patterns, which means that each one of the patterns forms from more than one upswing and downswing taking place in the market, and they all look similar to common shapes upon their completion.

The Head And Shoulders Pattern

The first price action reversal pattern we’re going to look at is the head and shoulders pattern. Without doubt one of the most popular and well known price action patterns in the market, the head and shoulders formation is one which all price action traders need to memorize and understand if they want to become good at spotting reversals using price action. As you’ve probably already guessed, the head and shoulders pattern is a reversal pattern which has a swing structure very similar to that of person’s head and shoulders.

image of bearish head and shoulders patternHere’s an image of a bearish head and shoulders pattern which formed on the 1hour chart of EUR/USD.

You can see from the image the structure of the pattern does bear a striking resemblance to somebody standing up with their head straight and their shoulders level with one another. Most head and shoulders patterns are supposed to look like the one you can see in the image above, but a large percentage of them will actually have features which are a little different from one another. For example, you might see a pattern form with one of the shoulders being a little bit higher than the other, or the distance of two shoulders from the head will be smaller or bigger than what you can see in the pattern above.

These small differences do not alter the pattern in any meaningful way. So long as the head is always found in the middle and the two shoulders are found to be either side, it’s a head and shoulder pattern. If the high of the right shoulder is found to be below the swing low of the move up which created the head, then it’s not a head and shoulders pattern and should not be treated as such.

The pattern itself comes in two variations. The one we just looked at in the image above is referred to as being a bearish head and shoulders pattern, which is a signal the market may reverse to the downside, whilst the one seen in the image below is a bullish head and shoulders pattern, but is often refereed to as being an inverse head and shoulders pattern due to the way the pattern is basically an upside down version of the bearish pattern.

image of bullish head and shoulders pattern Here’s what an inverted head and shoulders pattern looks like on a chart.

You can see that all the features of the pattern are the same as the bearish version, only the opposite way around. Instead of the head pointing upwards like it does with the bearish pattern it points down, as do the left and right shoulders. The only real difference between the two patterns is in what needs to happen in order for the pattern to become invalidated. With the bullish head and shoulders pattern if the right shoulder forms below the swing low of the move up which created the head, the pattern is not a head and shoulders and is instead some other formation. The bearish head and shoulders follows the same rule, only the right shoulder cannot form above the swing high of the move down which created the head, if it does it’s not a bearish head and shoulders pattern.

All in all the head and shoulders formation is usually quite a reliable signal the current movement is going to reverse. If you want to learn the best way to trade the head and shoulders pattern and get a more in-depth look at the way it should form on your charts, check out the article I’ve left below.

The Double Bottom And Double Top Patterns

The double bottom and double top formations are another couple of really important reversal patterns you need to be aware of forming in the market. They’re two  patterns which get their name from the way the market will make two downswings with swing lows at similar prices to one another before reversing, (in the case of the double bottom pattern) or two upswings with swing highs forming at similar prices to one another before reversing, in the case of the double top pattern.

image of double bottom pattern forming on usd/jpyThe image above shows an example of a double bottom pattern which formed on the 1hour chart of USD/JPY.

You can see the first part of the pattern forms after the market makes a downswing followed by an up-swing. The swing low that forms at the bottom of the swing higher is one of the two bottoms that forms during the pattern. The next swing low and bottom will always end up forming at a similar point to where this first swing low has formed, and the overall swing structure will usually resemble that of the letter W once the pattern has fully formed.

In this image we are looking at an example of the double top pattern.

The double top is of course the opposite to the double bottom, which means that it’s formation involves two upswings taking place with swing highs forming at similar prices to one another instead of two swing lows. Both patterns become invalidated if the second top or bottom in each respective pattern forms at a price which is far away from the price at which the first top or bottom has formed at. There isn’t any exact guidelines on how far away this should be, but I’d say that if you see two or three large candlesticks close below the first bottom or above the first top, then it’s probably not a double bottom or double top pattern.

Overall the double bottom and double top patterns are two decent reversal formations, although they can be quite difficult patterns to trade effectively, due to the way the swing seen after the second bottom or top has formed can easily turn into a retracement or consolidation soon after you would have entered a trade.

The Rising And Falling Wedge Pattern

The final two price action reversal patterns we’re going to look at, are the rising wedge and the falling wedge. The rising and falling wedges are two patterns which get their name from the way the market sometimes contracts before the end of an up-move or down-move. The contraction of the swings is what creates the wedge and gives the patterns their name.

image of rising wedge pattern
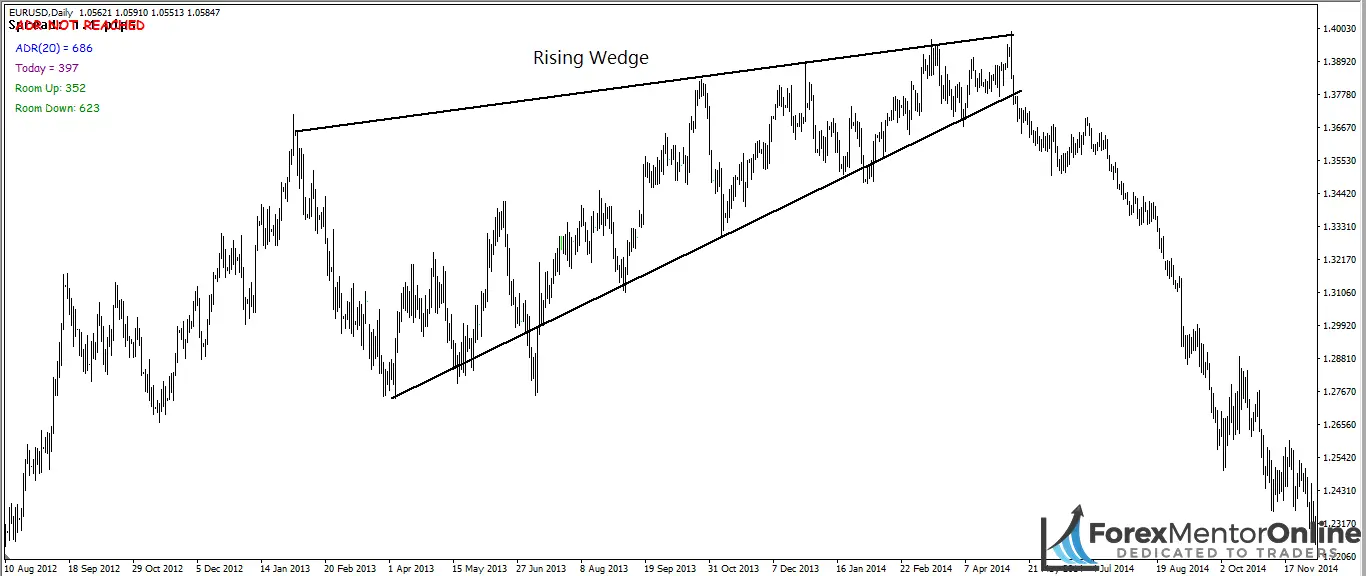
Here’s an image of a large rising wedge pattern which occurred on the daily chart of EUR/USD.

You can see that at the beginning of the wedge the distance between the market hitting the upper wedge line and lower wedge line is quite large. As the pattern progresses though, the distance between the two lines becomes smaller and smaller until eventually the two lines are really close to one another, almost as if they were about to form the tip on an arrow head.

image of falling wedge pattern 
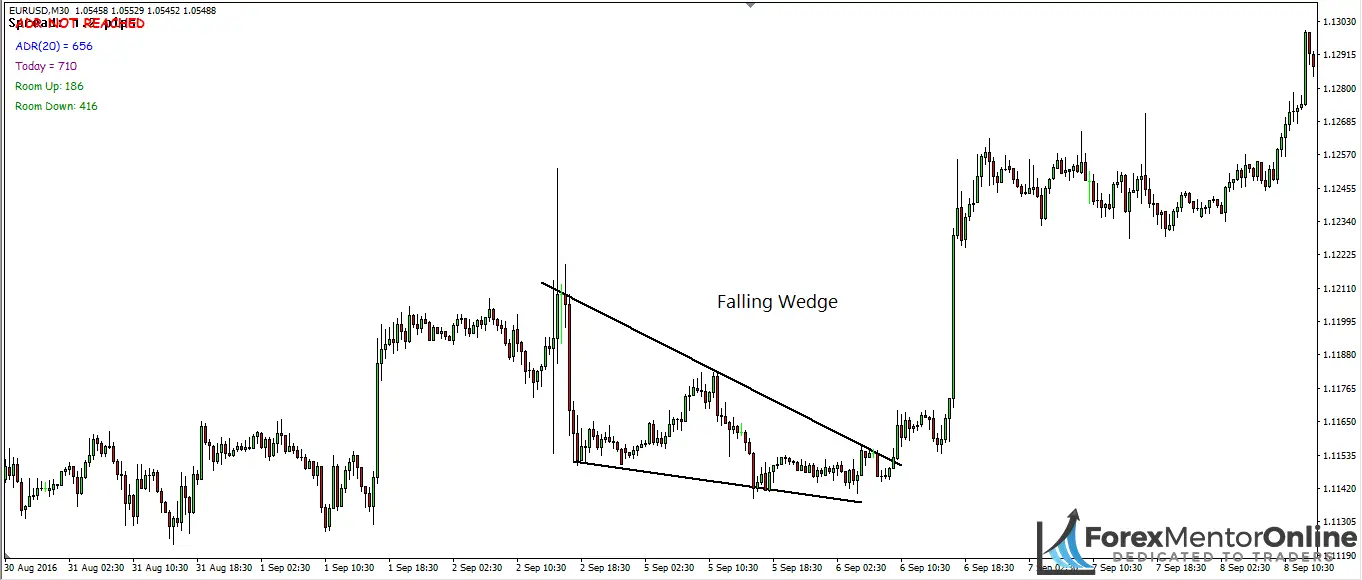
In this image we’re looking at an example of a falling wedge pattern.

The falling wedge is the bullish version of the wedge pattern and is always a signal the market may be about to reverse to the upside. It forms in much the same way as the rising wedge pattern, with the only difference being that the swings contract to the downside rather than the upside like they do during the formation of the rising wedge.

In closing, the rising and falling wedges are two patterns which are important for you to be able to recognize 0n a chart, but are not patterns which you should use to look for entries into trades, due to the way many false signals will appear as the swings contract and the pattern nears completion.

Wednesday 10 March 2021

The Ultimate Guide to Candlestick Charts

- 2 comments

 Stock market traders utilize a wide arsenal of tools to enhance their performance. One of the most essential tools are candlestick stock charts. These enable traders to visually interpret price action to make more informed decisions on trades especially when used in conjunction of other complementary tools and strategies. 

What is a Stock Chart? 

A stock chart is a graphical display of executed trades and various other data to provide a visual representation of the price action on the underlying stock. Charts are used to identify and analyze price support and resistance levels, trends, and historical patterns. There are various types of charts that can be used to interpret the action. Some of the most popular types of charts are bar charts, line charts and candlestick charts. Different traders have their own preferences between which charts to use since they utilize the same data but typically display them differently. 

Candlestick Chart For Day Trading

What are Candlestick Charts? 

Originally created by Japanese rice traders in 18th century Japan, candlestick charts were used to interpret price trends. They were introduced to the Western world by American Steven Nison through a series of books starting in 1991 with, “Japanese Candlestick Charting Techniques”. While originally plotted by hand, computer technology enabled them to be created quicker and more efficiently.  

The main appeal of candlestick charts is that they contain far more information than a simple line chart.

Why Most Traders User Candlestick Charts

Throughout the years, the practical nature and efficiency of candlesticks lent to their explosion in popularity. The adoption of candlestick charts by most trading platforms have made them the standard type of stock chart used by traders. Candlestick charts can be used across all financial instruments along with numerous indicators and patterns to develop trading strategies. They are easy to understand, convenient to use and enable efficient price interpretation.

Components of a Candlestick

The “timeframe” of a candlestick chart identifies the period of time that each candlestick represents. A 15-minute candlestick chart is composed of candlesticks representing 15-minute increments of data. A candlestick is composed of four components, which are key prices for that specified timeframe). These four components of a candlestick are the prices making the open, high, low and close:

  • The open is the first trade price for the candlestick period. This also marks one end of the body of the candle. 
  • The high is the highest trade price for the candlestick period and is also displayed as a wick, which is a vertical line.
  • The low is the lowest trade price for the candlestick period and also displayed as a wick or tail.
  • The close is the last trade price for the candlestick period and marks the other end of the body.

candlestick body is comprised of the open and close trades. If the open is higher than the close, then the body is colored red. If the open is lower than the close, then the body is colored green. The high and low is represented by the vertical lines above and below the body, also referred to as wicks or tails.

Candlestick Chart Analysis

The Story Behind Each Candle

Each candlestick represents a story in relation to price action. Consider each candlestick like a corner store in the neighborhood that sells fresh bread dynamically priced based on the day’s supply and demand.

Every open the first customer buys the first loaf and then the rest of the customers come do their shopping. Based on supply and demand, someone will pay a high price and someone will pay a low price. At the close of store hours, the last customer to buy a loaf of bread represents the close. If the last loaf sold for less than the first loaf, it indicates that demand has fallen. On the flipside, if the last loaf was sold at a higher price than the first loaf, it indicates demand is good. If customers came in and continues to buy bread at higher prices and the last load sold at the highest price of the day, it would be represented by a candlestick with no upper wick indicating demand was very strong. 

A Broader View

By stringing more candlesticks together, it paints a broader view of the supply and demand for the bread. A week’s worth of store data provides a more thorough gauge of the business. As time goes by, patterns will materialize and repeat themselves. Strategies to anticipate and manage these patterns can be developed to optimize business. This is how candlesticks are used, but instead of bread, it measures the price action of the underlying stock. 

Common Candlestick Patterns

Thanks to history having a habit of repeating itself, a number of time tested common candlestick patterns have been identified. 

Types of Candlestick Patterns

single candle is hard to interpret without context. Context refers to the preceding candles and, in many cases, the following candles. Make sure to always interpret the candle in context. For example, a single hammer candlestick alone can appear identical on two different charts. If the hammer candle forms after four preceding large red candles, then it carries more significance compared to a hammer candle that forms during a “consolidation” of alternating red and green candles. Therefore. common candlestick patterns tend to be composed of two to three consecutive candles. Even single candlesticks need a second candle to confirm the pattern.

Candlestick Patterns For Day Trading

Here’s a guide to some of the more common candlestick patterns to help you interpret price action as you develop trading strategies. Keep in mind that being told what a candlestick formation typical does and experiencing it firsthand are two different things. Take the information as a guide but always trust your firsthand experience to get an intuitive feel for the patterns.

Hammer candles indicate a potential ‘bottom’ price reversal. Hammers are composed of a smaller body and a tail that is at least two or more times the size of the body. They should be preceded by at least three consecutive lower low (tails) candles. Hammers reflect a capitulation selling climax as the last hold-outs decided to exit their shares in a panic. This may trigger buyers to come back into the stock lifting the price back up very close to or above the opening price.    

Hammer Candles Chart Pattern

Shooting Star candles are the opposite of a hammer, often referred to as an inverted hammer, indicating a potential price ‘top’. These form when buyers lose patience and chase an entry at any price they can get. This is illustrated by the long wick above a small body, which should be at least double the size of the body. Shooting star candles should be preceded by at least three consecutive higher high candles. While these are single candlesticks, they are only truly confirmed by the preceding candles and the following candlestick. 

Shooting Star Candles Chart Pattern

Doji candles are indicate indecision, either a price reversal or next leg is coming. They are composed of a flat body with long tails and wicks. The opening price is the same as the closing price. This sets the ‘line in the sand’ which the following candle will either close above or below to determine the direction of the price move. Doji candles can be bullish or bearish.

Doji Candles Chart Pattern

Engulfing candles are two-candlestick patterns that indicate a powerful price reversal. The preceding candlestick gets completely engulfed by the following candle. The body of the candle completely covers the whole range of the prior candle in the opposite direction with no tails or wicks. A bullish engulfing pattern forms at the bottom of a downtrend when the candle body completely engulfs the prior red candle including the highs and lows. A bearish engulf candle is the opposite as it forms at the top of the trend with a red candle body that completely swallows the high and low range of the prior green candle.

Engulfing Candles Chart Pattern

Harami candles are similar to engulfing candles but a smaller body forms after a large body candlestick to indicate a price reversal. This is also referring to as a “pregnant” woman two-candle pattern (harami is Japanese term for pregnant) as the smaller body candle forms within the range of the prior large candle. A bearish harami candle pattern forms at the bottom of a downtrend indicated by a smaller body candlestick that is contained within the prior low candle stock. The tail and wick should completely be contained within the range of the prior low candlestick. The bullish harami is the opposite version that forms at the top of a trend producing a smaller lower high candlestick contained with the body of the prior high candlestick.

Harami Candles Chart Pattern

Consider making Candlestick patterns an essential component of your trading system. As with all trading tools, attain firsthand knowledge and experience by tracking and following them on a regular basis so you can spot them quickly. Candlesticks are building blocks for technical analysis and strategy development. Familiarity is the crucial first step. 

How To Read Candlestick Charts

Monday 8 March 2021

EaseMyTrip IPO

- No comments

 Dear Investor,

'EaseMyTrip’ or Easy Trip Planners Limited is an online travel company that offers booking services for airline tickets, hotels, and holiday packages, along with bus/train tickets and travel insurance and it is launching its IPO from 8th to 10th March 2021.

You can apply for this IPO on the Upstox platform by clicking hereInvest in IPO

Here’s more information on EaseMyTrip to make an informed decision:
EaseMyTrip operates in the B2B, B2C, and travel agent-driven B2B2C segments. The New Delhi-based company was founded in 2008 and has been profitable since incorporation. The company has financed its working capital requirements and business expansion through funds generated from its operations, equity infusion from its promoters, and debt financing. Another USP of the company is that it provides customers with the option of no convenience fee for ticket bookings.

Crucially, the company claims to have recovered 70% booking volumes in the third quarter of the Covid-hit FY21 versus the same period last year. Meanwhile, recovery in booking volumes for rivals such as MakeMyTrip and Yatra Online stood at 46% and 44%, respectively.

Price band: ₹186-₹187
Lot size: 80 shares
Cost per lot: ₹14,960
Issue date: 8 - 10 March 2021
Allotment date: 16 March 2021

You can learn how to apply for an IPO by   clicking here.

Happy Investing,
Team StockAlphabets


Friday 5 March 2021

New IPO alert: MTAR Technologies IPO

- No comments
Dear Investor,

Machine Tools Aids and Reconditioning (MTAR) Technologies, is a precision engineering company that serves customers in the clean energy, nuclear, and space, and defense sectors and it is launching its IPO from 3rd to 5th March 2021.

You can apply for this IPO on the Upstox platform by clicking here - Invest in IPO

Here’s more information on MTAR Technologies to make an informed decision: Founded in 1970, MTAR has seven manufacturing facilities, each of which is situated in Hyderabad, Telangana. It counts US-based alternative energy company Bloom Energy as one of its key clients. Meanwhile, it is a supplier of mission-critical components to the Nuclear Power Corporation of India Limited (NPCIL), Indian Space Research Organisation (“ISRO”), and the Defence Research and Development Organisation (“DRDO”) for over three decades. Other notable clients include Hindustan Aeronautics Limited, Rafael, and Bharat Dynamics.

Price band: ₹574-575
Lot size: 26 shares
Cost per lot: ₹14,950
Issue date: 3 - 5 March 2021
Allotment date: 10 March 2021

You can learn how to apply for an IPO by clicking here.

Happy Investing,
Team Stock Alphabets


Tuesday 2 March 2021

Algo Trading

- No comments


 Introduction

 API is a set of rest APIs that provide integration with our in-house trading platform with which you can build your own customized trading applications. You can place fresh orders, modify and cancel existing orders in real-time. You can also get account related information such as orderbook, tradebook, net positions, holdings, and funds.

We have ensured maximum security for our APIs which prevent unauthorised transactions. All API requests and received only over HTTPS protocol.

App Creation

To use our APIs, you will be required to create an app from the API Dashboard.


  • Free Premium call 🏄
  • Free investment call🏆
  • Free Paid Video strategy🧘‍♀