Recent

3/recentposts

Popular Posts

Theme images by Storman. Powered by Blogger.

Sample Text

Pages

Unordered List

Recent in Sports

4/Sports/custom-widget

Home Ads

Home Ads

Tags

#1 Live Trading on Glenmark Pharmaceuticals Ltd #1 Live Trading on Godrej Industries Limited #3 Live Trading Session 1-2-3 Strategy 1-2-3-4 Reversal Trading Strategy 10 CHART PATTERNS FOR PRICE ACTION TRADING 10 Habits of successful traders 10 Performing Candlesticks 10 PRICE ACTION BAR PATTERNS YOU MUST KNOW 10 PRICE ACTION CANDLESTICK PATTERNS YOU MUST KNOW 10 Things You Can Learn From The World’s Best Traders 10 TYPES OF PRICE CHARTS FOR TRADING 123 forex trading strategy 123 Trading Strategy 200 SMA 3 Bar Net Line Strategy 6 Best Price Action Trading Strategies 7 RSI TRADING STRATEGIES 9 Advanced & Profitable Trading Strategy 9 Funny Facial Expressions AB = CD Price Action Strategy Abb India Limited Aditya Birla Nuvo Limited Aditya Birla Nuvo Ltd ADVANCED REVERSAL STRATEGY Alice Blue Opening Link Alphabets Amaraja Battries Ambuja Cement Anupam Rasayan India Limited IPO Asian Paint Ltd Aurobindo Pharma Limited Bajaj-Auto Bearish Crossover Bearish Engulfing Bearish Engulfing Candle Bearish Reversal (Red-Red) BEML Ltd Best Stock Market Strategy Bharat Finance Inclusion Blood Rain Pattern bollinger band Bollinger Band Price goes below Mid line Strategy Bollinger Band Price gone above mid line Bollinger Band Strategy Breakout Stock Trading Strategy Bullish Crossover Bullish Engulfing Bullish Gartley Pattern Strategy Bullish Three Bar Reversal Butterfly Spread Cadila Healthcare Limited Calendar Spread Camarilla Equition canara Bank Candlestick Charts Candlestick Patterns Candlestick Patterns Strategy Cesc Limited Chart Patterns Cipla Closing Above Previous High for 3 Days Closing Below Previous Low For 3 Days coal India Cup & Handle Pattern Daily Life of a Trader dark cloud cover Day Trading Breakout Day Trading Setups Day Trading Setups – 6 Classic Formations Day Trading Strategy DBLHC Descending Triangle Divergence Price Action Strategy DIVI'S Laboratories Ltd Doji Candlestick Patterns Dojis Double EMA Dr Reddy Dr. Reddy's Laboratories Limited Early Morning Range Breakouts – 4 Trading Strategies EMA Equity Market EXHAUSTION BAR Falling Wedges (26th Dec 2017) Federal Bank fibonacci Fibonacci Retracement Fibonacci Retrenchment Strategy Fibonacci swing trading strategy Flag Pattern Strategy Flash Pattern Forex Trading Strategies Fyers Account Gandhi Jayanti Gap Up Gartley Pattern Glenmark Pharmaceuticals Limited godrej Godrej Consumer Products Limited Godrej India Gppl Happy Birthday Happy Chhath Puja Happy Diwali Happy Diwali (2017) Happy Diwali (2018) Happy Dussehra Happy Ganesh Chaturthi Happy Holi Happy Independence Day 2017 Happy Janmashtami Happy Krishna Janmashtami 2017 Happy Muharram 2017 Happy Navratri To All Happy Teacher Day Harmonic Pattern HCL Technology HDFC HDFC Bank Head & Shoulders breakout Head & Shoulders Pattern (6th Oct 2017) Head and Shoulders Pattern Higher high of 3 days Hikkake Pattern Hindustan Petrolium Hindustan Unilever Hindustan Unilever Limited HOW TO DRAW TRENDLINES How To Trade Supply And Demand IndusInd Bank Indusind Bank Ltd Infosys INSIDE BAR Inside Bar - Outside Bar Inside Bar Trading Strategy by Stock Alphabets Inside Day Bar Intraday Intraday strategy Intraday strategy with Camarilla Equition intraday SureShot Intraday SureShot Official Post Intraday Trading Strategy Intraday/Day Trading Strategy inverted Head & Shoulders Irb Infrastructure Developers Limited Iron Condor Iron Fly Island Reversal Pattern Trading Strategy Jindal Steel & Power Limited Jk Lakshmi Cement Limited Jubilant Food Jubilant Foodworks Limited Kajaria Ceramics KEY REVERSAL BAR Kingfa Science and Technolgy (India) Ltd Kotak Mahindra Bank Limited Larson & Tarbo LIC LIC Housing Finance Limited Live Trading Lupin Limited M & M Finance Mahanagar gas Making Higher High for 3 Days Making Lower Lows for 3 Days Master Candle Master Candle Strategy Master Plus Candlesticks Meditation Mind Tree Mindtree Mobile App & Website for share market Momentum Divergence Strategy Morning and Evening Stars Moving Average Strategy My 10 price action secrets Naked Options NBCC (India) Limited New Mobile Application Annoucement NHPC Nifty Trend (12th August 2017) Nifty Trend line (10th August 2017) NMDC NMDC Cup & Handle Pattern NR7 NTPC Nureca Limited IPO Option Strangle (Long Strangle) Options Strategy Newsletter OUTSIDE BAR Outside Bar-Inside Bar Combo Pattern Pattern Strategy PATTERNS Pidilite India PINOCCHIO BAR (PIN BAR) PINOCCHIO BAR TRADE SETUP (PIN BAR) Piramal Enterprises Limited planting trees PNB POPGUN BAR PATTERN Price action Price Action Candlestick Patterns Price Action Continuation Patterns Price Action PATTERN # 6: Pin Bars PRICE ACTION PATTERN #1: DBLHC Price Action PATTERN #4: BEOVB Price Action PATTERN #5: BUOVB Price Action Patterns Price Action Pivot Point Strategy Price Action Sandwich Trading Setup Price Action Strategy Price Action Strategy Guide Price Action Strategy lover Price Action Trading Class Price Action Trading Course Price action trading strategy Price came back channel from bottom Price came back channel from Top Price gone below mid line Price-action-trading-strategies #Chapter-01 Price-action-trading-strategies-#Chapter-02 price-action-trading-strategies-#Chapter-03 Price-action-trading-strategies-#chapter-04 Profitable Level Profitable Level (13th Dec 2017) Profitable Level (14th Dec 2017) Profitable Level (15th Dec 2017) Profitable Level (18th Dec 2017) Profitable Level (18th Sept 2017) Profitable Pattern Profitable Trader Profitable Traders Do Nothing 99% Of the Time PVR RailTel IPO Ratio Spread Raymond Limited Reliance Capital Reliance Infra Repco Home Finance REVERSAL BAR PATTERN Risk/Reward Ross Hook Pattern Trading Strategy RSI RSI Divergence Strategy SBI Shooting Six Candle Concepts SMA Sodha Spring at Support & Resistance State Bank of India Stock Alphabets Stock Market Stock Market & Finance Movies Stock Market Strategy StockAlphabets Stop Loss Order Straddle Strangle Strategy EMA Strategy Resource Strip/ Strap sun Pharma Sun Pharmaceuticals Industries Limited Supertrend Supertrend Strategy support & Resistance Support & Resistance (25th Sept 2017) Support & Resistance (26th Dec 2017) Support & Resistance Strategy (6th Dec 2017) Support and Resistance Swerve pattern Swing Trading Strategies Swing Trading Strategy Tata Chemical Tata Global Beverages Tata Motors TCS The Best Stocks to Buy Now or Whenever The India Cements Limited The Outside Bar Trading Strategy Three Bar Reversal Three Candle Formation THREE-BAR PULLBACK Titan Company Limited Top Indian Companies with Monopoly Top 10 Continuation Candlesticks TOP 10 PRICE ACTION TRADING BOOKS Top 10 Reversal Candlesticks Top Monopoly stocks in India Torrent Torrent Pharmaceuticals Traders Trick Entry Trading System trading breakout Trading Key Reversal Bar Trading Psychology Trading Strategy Trading Strategy For Posstional & Intraday Trading System Trading the trend Trend line (25th Sept 2017) Trend line Strategy Trend line Strategy (14th Dec 2017) Trend Trading Analysis Prediction Trend-line Strategy (30th Nov 2017) Trendline Trendline (19th Sept 2017) Trendline (6th Nov 2017) Trendline Line Strategy Trendline strategy Trendline Strategy (19th Dec 2017) Trendline Strategy (2nd Dec 2017) Trendline Strategy (6th Dec 2017) Triagle Pattern TV18 Broadcast Limited TWO-BAR REVERSAL Types of Trader TYPICAL PRICE Typical Price Action Strategy ubl UBL Breakout Ujjivan Ujjivan Financial Services United Breweries Limited United Phosphorus Ltd Vertical Spread Volume Candlesticks Volume Trading Intraday Strategy W Pattern Wedge Pattern Strategy Wedges Price Action Strategy(16th Dec 2017) wedges Strategy (19th Dec 2017) Wipro Limited Wockhardt Limited Wolf Wave Strategy World’s Best Traders www.StockAlphabets.com Yes Bank Zee Entertainment Enterprises Limited Zydus Wellness

Travel

3/Travel/custom-widget

Comments

3/recentcomments

Ads

An�ncio

Latest in Sports

Sports

Random Posts

4/randomposts

Facebook

[Latest News][6]

#1 Live Trading on Glenmark Pharmaceuticals Ltd
#1 Live Trading on Godrej Industries Limited
#3 Live Trading Session
1-2-3 Strategy
1-2-3-4 Reversal Trading Strategy
10 CHART PATTERNS FOR PRICE ACTION TRADING
10 Habits of successful traders
10 Performing Candlesticks
10 PRICE ACTION BAR PATTERNS YOU MUST KNOW
10 PRICE ACTION CANDLESTICK PATTERNS YOU MUST KNOW
10 Things You Can Learn From The World’s Best Traders
10 TYPES OF PRICE CHARTS FOR TRADING
123 forex trading strategy
123 Trading Strategy
200 SMA
3 Bar Net Line Strategy
6 Best Price Action Trading Strategies
7 RSI TRADING STRATEGIES
9 Advanced & Profitable Trading Strategy
9 Funny Facial Expressions
AB = CD Price Action Strategy
Abb India Limited
Aditya Birla Nuvo Limited
Aditya Birla Nuvo Ltd
ADVANCED REVERSAL STRATEGY
Alice Blue Opening Link
Alphabets
Amaraja Battries
Ambuja Cement
Anupam Rasayan India Limited IPO
Asian Paint Ltd
Aurobindo Pharma Limited
Bajaj-Auto
Bearish Crossover
Bearish Engulfing
Bearish Engulfing Candle
Bearish Reversal (Red-Red)
BEML Ltd
Best Stock Market Strategy
Bharat Finance Inclusion
Blood Rain Pattern
bollinger band
Bollinger Band Price goes below Mid line Strategy
Bollinger Band Price gone above mid line
Bollinger Band Strategy
Breakout Stock Trading Strategy
Bullish Crossover
Bullish Engulfing
Bullish Gartley Pattern Strategy
Bullish Three Bar Reversal
Butterfly Spread
Cadila Healthcare Limited
Calendar Spread
Camarilla Equition
canara Bank
Candlestick Charts
Candlestick Patterns
Candlestick Patterns Strategy
Cesc Limited
Chart Patterns
Cipla
Closing Above Previous High for 3 Days
Closing Below Previous Low For 3 Days
coal India
Cup & Handle Pattern
Daily Life of a Trader
dark cloud cover
Day Trading Breakout
Day Trading Setups
Day Trading Setups – 6 Classic Formations
Day Trading Strategy
DBLHC
Descending Triangle
Divergence Price Action Strategy
DIVI'S Laboratories Ltd
Doji Candlestick Patterns
Dojis
Double EMA
Dr Reddy
Dr. Reddy's Laboratories Limited
Early Morning Range Breakouts – 4 Trading Strategies
EMA
Equity Market
EXHAUSTION BAR
Falling Wedges (26th Dec 2017)
Federal Bank
fibonacci
Fibonacci Retracement
Fibonacci Retrenchment Strategy
Fibonacci swing trading strategy
Flag Pattern Strategy
Flash Pattern
Forex Trading Strategies
Fyers Account
Gandhi Jayanti
Gap Up
Gartley Pattern
Glenmark Pharmaceuticals Limited
godrej
Godrej Consumer Products Limited
Godrej India
Gppl
Happy Birthday
Happy Chhath Puja
Happy Diwali
Happy Diwali (2017)
Happy Diwali (2018)
Happy Dussehra
Happy Ganesh Chaturthi
Happy Holi
Happy Independence Day 2017
Happy Janmashtami
Happy Krishna Janmashtami 2017
Happy Muharram 2017
Happy Navratri To All
Happy Teacher Day
Harmonic Pattern
HCL Technology
HDFC
HDFC Bank
Head & Shoulders breakout
Head & Shoulders Pattern (6th Oct 2017)
Head and Shoulders Pattern
Higher high of 3 days
Hikkake Pattern
Hindustan Petrolium
Hindustan Unilever
Hindustan Unilever Limited
HOW TO DRAW TRENDLINES
How To Trade Supply And Demand
IndusInd Bank
Indusind Bank Ltd
Infosys
INSIDE BAR
Inside Bar - Outside Bar
Inside Bar Trading Strategy by Stock Alphabets
Inside Day Bar
Intraday
Intraday strategy
Intraday strategy with Camarilla Equition
intraday SureShot
Intraday SureShot Official Post
Intraday Trading Strategy
Intraday/Day Trading Strategy
inverted Head & Shoulders
Irb Infrastructure Developers Limited
Iron Condor
Iron Fly
Island Reversal Pattern Trading Strategy
Jindal Steel & Power Limited
Jk Lakshmi Cement Limited
Jubilant Food
Jubilant Foodworks Limited
Kajaria Ceramics
KEY REVERSAL BAR
Kingfa Science and Technolgy (India) Ltd
Kotak Mahindra Bank Limited
Larson & Tarbo
LIC
LIC Housing Finance Limited
Live Trading
Lupin Limited
M & M Finance
Mahanagar gas
Making Higher High for 3 Days
Making Lower Lows for 3 Days
Master Candle
Master Candle Strategy
Master Plus Candlesticks
Meditation
Mind Tree
Mindtree
Mobile App & Website for share market
Momentum Divergence Strategy
Morning and Evening Stars
Moving Average Strategy
My 10 price action secrets
Naked Options
NBCC (India) Limited
New Mobile Application Annoucement
NHPC
Nifty Trend (12th August 2017)
Nifty Trend line (10th August 2017)
NMDC
NMDC Cup & Handle Pattern
NR7
NTPC
Nureca Limited IPO
Option Strangle (Long Strangle)
Options Strategy Newsletter
OUTSIDE BAR
Outside Bar-Inside Bar Combo Pattern
Pattern Strategy
PATTERNS
Pidilite India
PINOCCHIO BAR (PIN BAR)
PINOCCHIO BAR TRADE SETUP (PIN BAR)
Piramal Enterprises Limited
planting trees
PNB
POPGUN BAR PATTERN
Price action
Price Action Candlestick Patterns
Price Action Continuation Patterns
Price Action PATTERN # 6: Pin Bars
PRICE ACTION PATTERN #1: DBLHC
Price Action PATTERN #4: BEOVB
Price Action PATTERN #5: BUOVB
Price Action Patterns
Price Action Pivot Point Strategy
Price Action Sandwich Trading Setup
Price Action Strategy
Price Action Strategy Guide
Price Action Strategy lover
Price Action Trading Class
Price Action Trading Course
Price action trading strategy
Price came back channel from bottom
Price came back channel from Top
Price gone below mid line
Price-action-trading-strategies #Chapter-01
Price-action-trading-strategies-#Chapter-02
price-action-trading-strategies-#Chapter-03
Price-action-trading-strategies-#chapter-04
Profitable Level
Profitable Level (13th Dec 2017)
Profitable Level (14th Dec 2017)
Profitable Level (15th Dec 2017)
Profitable Level (18th Dec 2017)
Profitable Level (18th Sept 2017)
Profitable Pattern
Profitable Trader
Profitable Traders Do Nothing 99% Of the Time
PVR
RailTel IPO
Ratio Spread
Raymond Limited
Reliance Capital
Reliance Infra
Repco Home Finance
REVERSAL BAR PATTERN
Risk/Reward
Ross Hook Pattern Trading Strategy
RSI
RSI Divergence Strategy
SBI
Shooting
Six Candle Concepts
SMA
Sodha
Spring at Support & Resistance
State Bank of India
Stock Alphabets
Stock Market
Stock Market & Finance Movies
Stock Market Strategy
StockAlphabets
Stop Loss Order
Straddle
Strangle
Strategy EMA
Strategy Resource
Strip/ Strap
sun Pharma
Sun Pharmaceuticals Industries Limited
Supertrend
Supertrend Strategy
support & Resistance
Support & Resistance (25th Sept 2017)
Support & Resistance (26th Dec 2017)
Support & Resistance Strategy (6th Dec 2017)
Support and Resistance
Swerve pattern
Swing Trading Strategies
Swing Trading Strategy
Tata Chemical
Tata Global Beverages
Tata Motors
TCS
The Best Stocks to Buy Now or Whenever
The India Cements Limited
The Outside Bar Trading Strategy
Three Bar Reversal
Three Candle Formation
THREE-BAR PULLBACK
Titan Company Limited
Top Indian Companies with Monopoly
Top 10 Continuation Candlesticks
TOP 10 PRICE ACTION TRADING BOOKS
Top 10 Reversal Candlesticks
Top Monopoly stocks in India
Torrent
Torrent Pharmaceuticals
Traders Trick Entry Trading System
trading breakout
Trading Key Reversal Bar
Trading Psychology
Trading Strategy
Trading Strategy For Posstional & Intraday
Trading System
Trading the trend
Trend line (25th Sept 2017)
Trend line Strategy
Trend line Strategy (14th Dec 2017)
Trend Trading Analysis Prediction
Trend-line Strategy (30th Nov 2017)
Trendline
Trendline (19th Sept 2017)
Trendline (6th Nov 2017)
Trendline Line Strategy
Trendline strategy
Trendline Strategy (19th Dec 2017)
Trendline Strategy (2nd Dec 2017)
Trendline Strategy (6th Dec 2017)
Triagle Pattern
TV18 Broadcast Limited
TWO-BAR REVERSAL
Types of Trader
TYPICAL PRICE
Typical Price Action Strategy
ubl
UBL Breakout
Ujjivan
Ujjivan Financial Services
United Breweries Limited
United Phosphorus Ltd
Vertical Spread
Volume Candlesticks
Volume Trading Intraday Strategy
W Pattern
Wedge Pattern Strategy
Wedges Price Action Strategy(16th Dec 2017)
wedges Strategy (19th Dec 2017)
Wipro Limited
Wockhardt Limited
Wolf Wave Strategy
World’s Best Traders
www.StockAlphabets.com
Yes Bank
Zee Entertainment Enterprises Limited
Zydus Wellness

Thursday 18 July 2019

10 Things You Can Learn From The World’s Best Traders

- 6 comments

Today’s lesson is a virtual treasure trove of wisdom and insight from some of the best trading minds of all time. We are going to go on a journey of discovery and learn a little about some of the best traders ever and dissect some of their famous quotes to see what we can learn and how it applies to our own trading.
The way to learn anything is to learn from the greats, have mentors, teachers, study and read; you must make a concerted effort to absorb as much knowledge from the best in your field as possible, for that is truly the fastest way to success, be it in trading or any other field.
Below, you will find a brief introduction to 10 of the best traders of all time, followed by an inspiring quote from them and how I view that quote and apply it to my own trading principles. Hopefully, after reading today’s lesson you will be able to apply this wisdom to your own trading and start improving your market performance as a result…

George Soros

George Soros gained international notoriety when, in September of 1992, he invested $10 billion on a single currency trade when he shorted the British pound. He turned out to be right, and in a single day the trade generated a profit of $1 billion – ultimately, it was reported that his profit on the transaction almost reached $2 billion. As a result, he is famously known as the “the man who broke the Bank of England.”
Soros went off on his own in 1973, founding the hedge fund company of Soros Fund Management, which eventually evolved into the well-known and respected Quantum Fund. For almost two decades, he ran this aggressive and successful hedge fund, reportedly racking up returns in excess of 30% per year and, on two occasions, posting annual returns of more than 100%.
Here is a famous quote from Mr. Soros:
“Markets are constantly in a state of uncertainty and flux and money is made by discounting the obvious and betting on the unexpected.”

Jesse Livermore

Livermore, who is the author of “How to Trade in Stocks”(1940), was one of the greatest traders of all time. At his peak in 1929, Jesse Livermore was worth $100 million, which in today’s dollars roughly equates to $1.5-13 billion, depending on the index used. He is most famous, perhaps, for selling short U.S. stocks before they crashed in 1929, swelling his bank account to $100 million.
Here is a famous quote from Jesse Livermore:
“Play the market only when all factors are in your favor. No person can play the market all the time and win. There are times when you should be completely out of the market, for emotional as well as economic reasons.”
The above quote by Jesse Livermore is one of my favorites. I am all about keeping a low-frequency trading approach and trading like a sniper not a machine gunner which is also what Livermore is saying here. Playing the market when all factors are you in favor means, as with other quotes in this lesson (seeing a theme here?) trading with confluence. He says you should be out of the market at times for emotional as well as economic reasons. Meaning, for your trading account’s sake and your mindset’s sake, you should not be in the market all the time. In fact, most of the time you should be out of the market, which is a cornerstone of my trading philosophy.

Ed Seykota

Trading as a trend follower, Ed Seykota turned $5,000 into $15,000,000 over a 12-year time period in his model account – an actual client account. In the early 1970s, Seykota was hired as an analyst by a major brokerage firm. He conceived and developed the first commercial computerized trading system for managing clients’ money in the futures markets 
Here is quote from Ed Seykota from The Market Wizards by Jack D. Schwager:
“Fundamentals that you read about are typically useless as the market has already discounted the price, and I call them “funny-mentals”. I am primarily a trend trader with touches of hunches based on about twenty years of experience. In order of importance to me are: (1) the long-term trend, (2) the current chart pattern, and (3) picking a good spot to buy or sell. Those are the three primary components of my trading. Way down in a very distant fourth place are my fundamental ideas and, quite likely, on balance, they have cost me money.”

John Paulson

Paulson became world-famous in 2007 by shorting the US housing market, as he foresaw the subprime mortgage crisis and bet against mortgage backed securities by investing in credit default swaps. Sometimes referred to as the greatest trade in history, Paulson’s firm made a fortune and he earned over $4 billion personally on this trade alone.
Here is a great quote from John Paulson:
Many investors make the mistake of buying high and selling low while the exact opposite is the right strategy.”
What he means here, is that most investors and traders will tend to buy when a market is high, typically because that’s when it looks and feels good to buy. However, when a market has already moved up a lot, it’s typically ready to pullback, which is why I like to trade on market pull backs in most cases. The inverse is true for shorting; when a market has sold-off big time, you usually don’t want to sell, or you’ll end up selling the bottom, so to speak. You want to wait for a bounce in price, back to a resistance or value area, then watch for a price action sell signal there to rejoin the trend after a pull back.

Paul Tudor Jones

Paul Tudor Jones shorting of Black Monday was one of the most famous trades ever. Paul Tudor Jones correctly predicted on his documentary in 1986 based on chart patterns that the market was on the path to a crash of epic proportions. He profited handsomely from the Black Monday crash in the fall of 1987, the largest single-day U.S. stock market decline (by percentage) ever. Jones reportedly tripled his money by shorting futures, making as much as $100 million on that trade as the Dow Jones Industrial Average plunged 22 percent. An amazing trade to walk away from with a fortune when so many others were ruined in the aftermath. He played it to perfection. His funds had great consistent returns for decades.
Here is a favorite quote of mine from Paul Tudor Jones featured in the Market Wizards:
“That was when I first decided I had to learn discipline and money management. It was a cathartic experience for me, in the sense that I went to the edge, questioned my very ability as a trader, and decided that I was not going to quit. I was determined to come back and fight. I decided that I was going to become very disciplined and businesslike about my trading.”
What Jones is saying here, is that there will be a time when every trader makes a huge mistake regarding money management, and they must take a cold, hard look at themselves and decide what to do next. Will you continue to bleed money from your account by continuing to make poor money management decisions? Or, will you finally get disciplined and “businesslike” in your trading? In trading, money management is literally what determines your fate, so you need to focus on it early-on if you want to have any chance of success.

Richard Dennis

Richard J. Dennis, a commodities speculator once known as the “Prince of the Pit,” was born in Chicago, in January, 1949. In the early 1970s, he borrowed $1,600 and reportedly made $200 million in about ten years. Dennis and his friend William Eckhardt, are most famous for starting the Turtle Traders, which was a group of 21 average people to whom they taught their rules to and proved that anyone, given the right training, could trade successfully. 
Here is a good quote from Richard Dennis:
“I’ve certainly done it – that is, made counter-trend initiations. However, as a rule of thumb, I don’t think you should do it.”
Richard Dennis was famously a very successful trend trader and in the above quote he is stating his feelings on trading counter trend. Interestingly, this is pretty much how I feel about trading counter-trend; sometimes it’s warranted, but most of the time it’s not, and it takes a skilled trader to be able to trade counter-trend successfully. I teach my students to master trading with the trend first and foremast and to make that the most important piece of their technical analysis.

Stanley Druckenmiller

Stanley Druckenmiller is an American investor, hedge fund manager and philanthropist.
In 1988, he was hired by George Soros to replace Victor Niederhoffer at Quantum Fund. He and Soros famously “broke the Bank of England” when they shorted British pound sterling in 1992, reputedly making more than $1 billion in profits. They calculated that the Bank of England did not have enough foreign currency reserves with which to buy enough sterling to prop up the currency and that raising interest rates would be politically unsustainable. 
“I’ve learned many things from him [George Soros], but perhaps the most significant is that it’s not whether you’re right or wrong that’s important, but how much money you make when you’re right and how much you lose when you’re wrong.”
The above quote is reference to George Soros who mentored Druckenmiller for a while. This quote fits perfectly with an article I wrote recently about how you don’t have to be right to make money trading. Most traders get far too concerned about the number of winners they have compared to losers when really, they should totally forget about that number and instead focus on their overall risk / reward. In other words, how much money are they making for every dollar they have risked.

Jim Rogers

James Beeland “Jim” Rogers, Jr. is a Singapore based business magnate of American origin. Regarded by the business world as a brilliant investor, Rogers is also an author and financial commentator. He co-founded the global investment partnership, Quantum Fund, along with George Soros, another equally brilliant businessman. 
Here’s one of my all-time favorite trading and investing quotes, courtesy of Mr. Rogers:
“I just wait until there is money lying in the corner, and all I have to do is go over there and pick it up. I do nothing in the meantime. Even people who lose money in the market say, “I just lost my money, now I have to do something to make it back.” No, you don’t. You should sit there until you find something.”
I really like the part above where Jim Rogers says “I just wait until there is money lying in the corner…” because that really sums up what I try to teach my students as well as my own personal trading style. Rogers is dead-on with the above quotes; most traders do WAY too much…there is nothing wrong with doing nothing if there isn’t anything to do! In other words, don’t force a trade if an obvious one isn’t there, it’s better to save your capital for a solid opportunity that’s just around the corner.

Ray Dalio

Raymond Dalio is an American billionaire investor, hedge fund manager, and philanthropist. Dalio is the founder of investment firm Bridgewater Associates, one of the world’s largest hedge funds. As of January 2018, he is one of the world’s 100 wealthiest people, according to Bloomberg. 
Here is a pretty deep quote by Ray Dalio:
“I believe that the biggest problem that humanity faces is an ego sensitivity to finding out whether one is right or wrong and identifying what one’s strengths and weaknesses are.”
This quote by Mr. Dalio is deep, for a few reasons. One, having a sensitive ego is very bad in trading, because the fact is, you’re going to have losing trades, probably more than you want. So, if you become overly-affected / emotional by every loser, it’s going to catapult you into a huge string of trading mistakes, as I wrote about more in-depth in my article on the top trading mistakes people make.
Next, being right or wrong is and should be 100% irrelevant in trading. As the late, great Mark Douglas teaches, you can be wrong on average and still make money, and your trading success or failure doesn’t depend on whether you’re right on your next trade, read my article on the secret to trading success for more on this. Finally, you must determine what your strengths and weaknesses are as a person before you can find trading success. We all drag our personal baggage into the markets and it influences our trading, for better or worse.

Warren Buffet

Known as the “Oracle of Omaha,” Warren Buffett is one of the most successful investors of all time. He runs Berkshire Hathaway, which owns more than 60 companies, including insurer Geico, battery maker Duracell and restaurant chain Dairy Queen. He has committed to giving more than 99% of his fortune to charity. So far, he has given nearly $32 billion.  
Here is perhaps a lesser-known quote from Warren but one that I like nonetheless:
“Opportunities come infrequently. When it rains gold, put out the bucket, not the thimble”
To me, this quote is saying that high-probability trade signals happen infrequently, which is something I teach as any of you know who have followed me for any length of time. Thus, when you do get a nice and obvious / confluent trade signal (there’s that confluent word again) you need to maximize your gains, not take a quick / easy profit. This fits nicely in my teachings about the power of risk reward and how to catch big moves in the market. I am all about waiting patiently, with discipline, for days, weeks or even months and then pouncing on that one super-obvious setup that will net me a large 1:3, 1:4, 1:5 or even greater winner. This is the basis behind my approach that proves you don’t need to win a lot to make money trading.

Conclusion

Personally, if you’re a beginning or struggling trader, I think the most important thing to takeaway from all the wisdom in today’s lesson is to first get YOURSELF straight; get your money straight, get your patience and discipline straight, know what your trading edge is and how to properly trade it BEFORE you start risking real money in the markets. If you do this, you will largely be trading in-line with the insight and advice that the above trading greats have provided you with.

Note:


Risk Disclaimer

All information is for educational purposes only. Nothing should be considered as a buy or sell recommendation. The risk of loss in trading stocks, commodity futures and options is substantial. Before trading, you should carefully consider your financial position to determine if trading is appropriate. When trading stock, futures or options, it is possible to lose more than the full value of your account. All funds committed should be risk capital. Past performance is not necessarily indicative of future results. This email may is a paid advertisement. It could be for a product or service that is not offered, recommended or endorsed by Stock Alphabets and neither the company nor its affiliates bear responsibility or control over the content of the advertisement and the product or service offered. Proceed at your own risk.
The information and material contained in these pages and the terms, conditions, and descriptions that appear are subject to change without prior notice. Investments in equity shares, debentures etc, are not obligations of or guaranteed by the Stock Alphabets, and are subject to investment risks.

Sunday 7 July 2019

10 Habits of successful traders

- 6 comments

Note:


Risk Disclaimer

All information is for educational purposes only. Nothing should be considered as a buy or sell recommendation. The risk of loss in trading stocks, commodity futures and options is substantial. Before trading, you should carefully consider your financial position to determine if trading is appropriate. When trading stock, futures or options, it is possible to lose more than the full value of your account. All funds committed should be risk capital. Past performance is not necessarily indicative of future results. This email may is a paid advertisement. It could be for a product or service that is not offered, recommended or endorsed by Stock Alphabets and neither the company nor its affiliates bear responsibility or control over the content of the advertisement and the product or service offered. Proceed at your own risk.
The information and material contained in these pages and the terms, conditions, and descriptions that appear are subject to change without prior notice. Investments in equity shares, debentures etc, are not obligations of or guaranteed by the Stock Alphabets, and are subject to investment risks.

Saturday 29 June 2019

4 Crazy Price Action Strategy Tips That Will Give Immediate Results!

- 4 comments
forex price action tips article coverDo you want to be able to open up any price chart, and forecast near term price action with confidence on your own?
Every trader aspires to be an awesome technical analyst. It’s one of the core skills needed to be able to trade the Forex market like a boss.
Price Action Trading is the methodology you will eventually fall in love with.
Let’s face it, it’s a very seductive and addictive form of analysis, and when done right – very lucrative!
At it’s core, price action is something trading systems need, and many have been derived from its principles.
Once you master the charts, you can come up with your own flavor of trading system that works for you and be proud of its results.
But first, you need to master the charts, and become your own king of technical analysis.
In this guide, I’ve got some awesome tips that will make the charts just pop out at you, instilling a huge boost in clarity in your analysis next time you open your trading software!
Are you ready? Let’s begin…

perform.
Since this is my first candlestick pattern strategy evaluation, I wanted to focus on something really really simple – the candle body.

1. Get Context  – Read The Story Of Price Action

getting context with the price actionWhat’s the number 1 issue with price action noobs?
Easy, trading candlestick patterns in isolation!
This has got to be the trap that every new trader trips over when they first open the door to trade price action, and continue to be stuck with this toxic mindset!
I really can’t stress this enough – a candlestick pattern on it’s own is a very weak signal!
Actually, I have some fun fact data to share from some recent testing.
I wrote a program to evaluate a scenario that would trade every single candlestick reversal, specifically the pin bar / rejection candle.
The program only looks exclusively for the pattern as a trade signal, that’s it!  It doesn’t care about the size of the candle, the market conditions, nothing! If the Forex price action pattern appears, it starts recording data.
Can you guess what the success rate was?
Taking ever single pin bar candlestick signal (across various pairs and time frames), averages out have about a 20% expected success rate – which in real life trading terms, is like jumping on the bankruptcy bus.
every single rejection pin bar candle taken result
Candlestick patterns are awesome to use, but they should not be the first, or only factor in your trade decision making process.
This is where I drive home the point to look beyond the candlestick patterns, and get market context BEFORE you make a trade decision.
When analyzing the price action context, some things you need to consider are:
  • Current price structure
  • What’s happening on the higher time frames
  • Forex price action to the left
  • Relative location of price to other important technical factors
  • Presence of price action reacting with support, resistance, trend line structures etc
If I could illustrate my point here, I would show two charts. The bad way, and the professional way to approach candlestick signals.
bad approach to candlestick patterns
Look at the flow chart above, is this level of decision making you take when putting your money on the line?
Now look at the chart below, this is how I recommend you approach a trade decision that involves a candlestick pattern. Give this a try…
candlestick patterns decision making process table - the right way
The success rate is much harder to achieve with a quantitative simulation, due to the discretionary (human decision) factors –  so I can’t put a % against this, but I will continue with my work here.
If you’re guilty of the first flow chart, try switch to the ‘get context’ flow chart, and watch how quickly you start filtering out bad signals.
Check out this example…
candlestick signal with no price action context
Above: Very hard to build value to a ‘sell trade’ here, based off the pin bar candlestick alone.
If you look beyond the candlestick, you can see the market is very bullish. That’s evident by the higher highs, and higher lows being printed, which is the footprint of a bullish trending market
If you want to sell against that, you need to have really strong technical evidence that a reversal is likely to occur (I’ll cover that later in the tutorial).
out of context signal fails as expected
Above: The ‘what happened after’ shot. As expected the bullish moment continued, because that’s what the market structure was screaming after. Market structure analysis through reading price action takes priority over candlestick signals (remember the flow chart above).
Any price action based signal is going to dramatically change in value depending what kind of market environment the trade setup forms in.
Lets take a look at a signal that fits within the market context…
good price action signal in context with the technicals
Above: A candlestick signal that fits well within the ‘story’ price action is communicating here.
A similar structure to the previous example. This market is making higher highs, and higher lows – a bullish market, where we should be looking to buy only.A bullish rejection candle formed here, and off a trend swing level. The trade idea is within context and has a lot of technical value.
good price action analysis wins as the signal reaches into higher highs
Above: The bullish rejection candlestick signal had good follow through, which is expected, because it was backed by many technical factors – aligning it with the market context.
Checkpoint
Start looking beyond the candlestick patterns. Take a step (or two) back, look at the market structure, and other technical factors like support and resistance (especially weekly S/R) to help build value into a buy or sell trade idea. Then see if the candlestick signal has synergy with your price action analysis.

2. Top Down Analysis is A Critical Step For Price Action Traders

top down analysis concept art
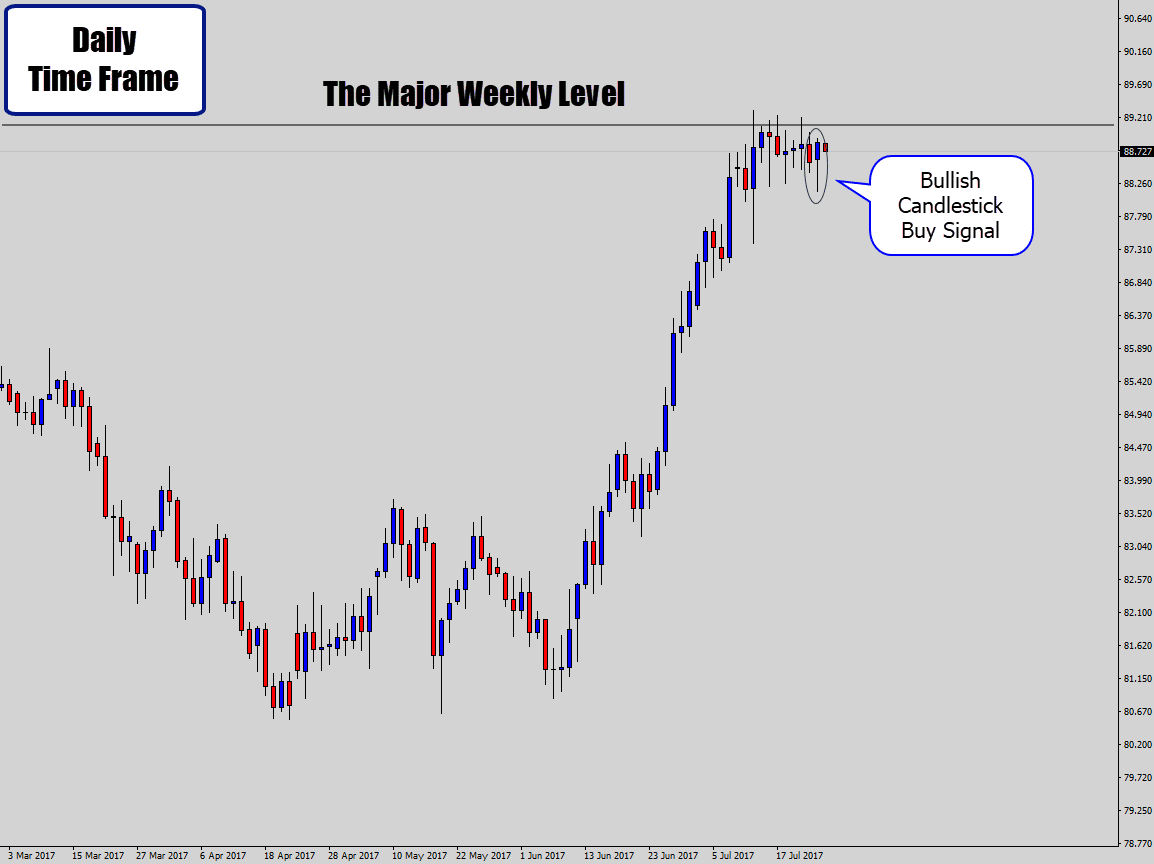
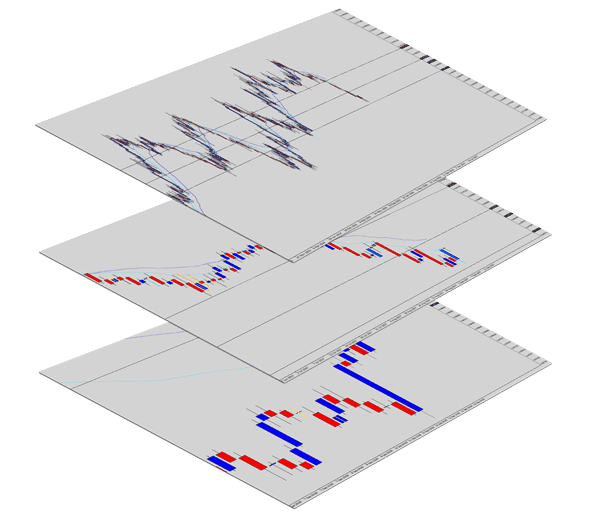
You might have heard the term ‘top down analysis’ being passed around the Forex communities from time to time. This nicely complements the ‘getting context’ tip above.
Top-down analysis is the idea of aligning what’s going on in the market from a higher time frame perspective (top), and then stacking it with your trading time frame analysis(down) – to create strong synergy with your trade idea.
This is a critical, and an overlooked step when evaluating a trade idea by many traders who are trying to learn price action trading.
To begin, start your analysis from the top time frame – I recommend using the weekly chart for your entry point.
The weekly chart offers a lot of value, big technical details that you might otherwise miss on your trading time frame. I mostly use the top time frame (weekly chart) for gathering information.
I am looking for information such as:
  • Critical support and resistance levels: Levels which have proven to act as a major turning point in the market before.
  • Dominant technical features: Major trend line structures or price squeezing structures.
  • The market structure:  Which way are we moving/trending? Where are we within a range? Is this a choppy consolidation period?
  • Previous weekly candle anatomy: Provides good insight to where price is likely to try move.
Then we move down to the trading time frame…
Because I am dominantly a swing trader, that’s anything between the “4 hour” to “Daily” charts. Occasionally I will use the 1 hour chart for an aggressive swing trade entry, but only when I can build very strong top down analysis.
When you’re on your primary trading time frame, it is business as usual – looking for details such as:
  • Market structures: trending, ranging, etc.
  • Turning points: trend lines, swing levels, support/resistance or whatever your trading system dictates is a technical feature.
  • A clear trade signal: usually a candlestick pattern, or some kind of price action event.
To illustrate why this is important, lets walk through an example where we disregard top down analysis and focus only on the trading time frame.
This example is a ‘what can happen’ if you ignore the bigger picture, so we will just check in to see what the higher time frame chart is communicating  so I can make my point…
As per usual, I begin on the weekly time frame.
top down analysis starting at weekly time frame
From the weekly time frame we gather the key information I would normally bring down to the trading time frame.
We can see price is testing a major weekly resistance level here. This is something we do not want to attempt to buy through.
It is a risky practice to try trade ‘through’ weekly turning points.
If anything, we could consider looking for sell signals off that level on our trading time frame.
Now we have the information in hand, keep it in mind. We will go to the trading time frame – in this case, the daily chart, and disregard what we’ve learned from the weekly chart.
price action buy signal occurs under weekly level
So we see a bullish candlestick signal on the daily chart.
If you were stuck in the mind-set of ‘trading a candlestick signal just because it’s there’, then you might take taken this.
This is what happened next…
the weekly time frame dominates the price action on the lower time frames
Above: A classic scenario where the higher time frame analysis overpowers the single value of a candlestick trade signal on the trading time frame.
In this case, it is bad practice to try and challenge the market by buying or selling through proven major turning points.
Without the top down analysis element here, we could have easily overlooked the major level, not even knowing the danger was there in the first place.
This is the kind of ‘tunnel vision’ a lot of faster paced, lower time frame traders suffer from.
Top down analysis is extremely important when you’re thinking about trading counter trend. I am speaking from a swing trading point of view, where you’re looking to catch a really big move.
Higher time frame analysis actually becomes paramount in a counter trend trade decision!
price testing major level on weekly chart
Above: Starting our top down analysis, we can see the price is testing a major level.
We look to the left and see this level is a proven turning point, so we can only logically anticipate one thing – a good chance of a reversal occurring.
Next step: look for signals to fit that analysis on the trading time frame.
bearish counter trend reversal signal
Above: We step down onto our trading time frame and see a bearish candlestick sell signal.
This signal fits the context of the market, and aligns with our higher time frame analysis. An authoritative counter trend signal which builds a very strong case to position against the existing market trend.
If the signal follows through with this bearish pattern, it’s like to be a very extended move, as weekly levels tend to be the starting point for complete trend reversals.
counter trend signal follows through with strong bearish price action
Above: A powerful example of counter trend trading done right.
You’ve heard the sayings over and over: ‘trade with the trend only‘, ‘the trend is your friend‘.
Well, those catch phrases are only true while the trending context is relevant.
You need to use top down analysis to make sure you’re not going to trade into any serious trouble spots, or even better – use the technique to spot lucrative counter trend signals, like the one shown above.
A lot of traders are very reluctant to move into lower time frames, due to a lot of misconceptions about trading on charts like the daily and weekly.
Let me extinguish all your fires right here: Busting myths about trading Forex price action on the daily charts.
Checkpoint
Top down analysis is the discipline of aligning technical analysis from a higher time frame, with your trading time frame. The weekly chart works best for swing trading top down analysis. It will give you a clear picture of what you should be doing in the market, help you build value into your trading signals, and help you spot the best counter trend opportunities.

3. Focus on Charts With Clear Price Action to the Left

look left analogy for technical analysis
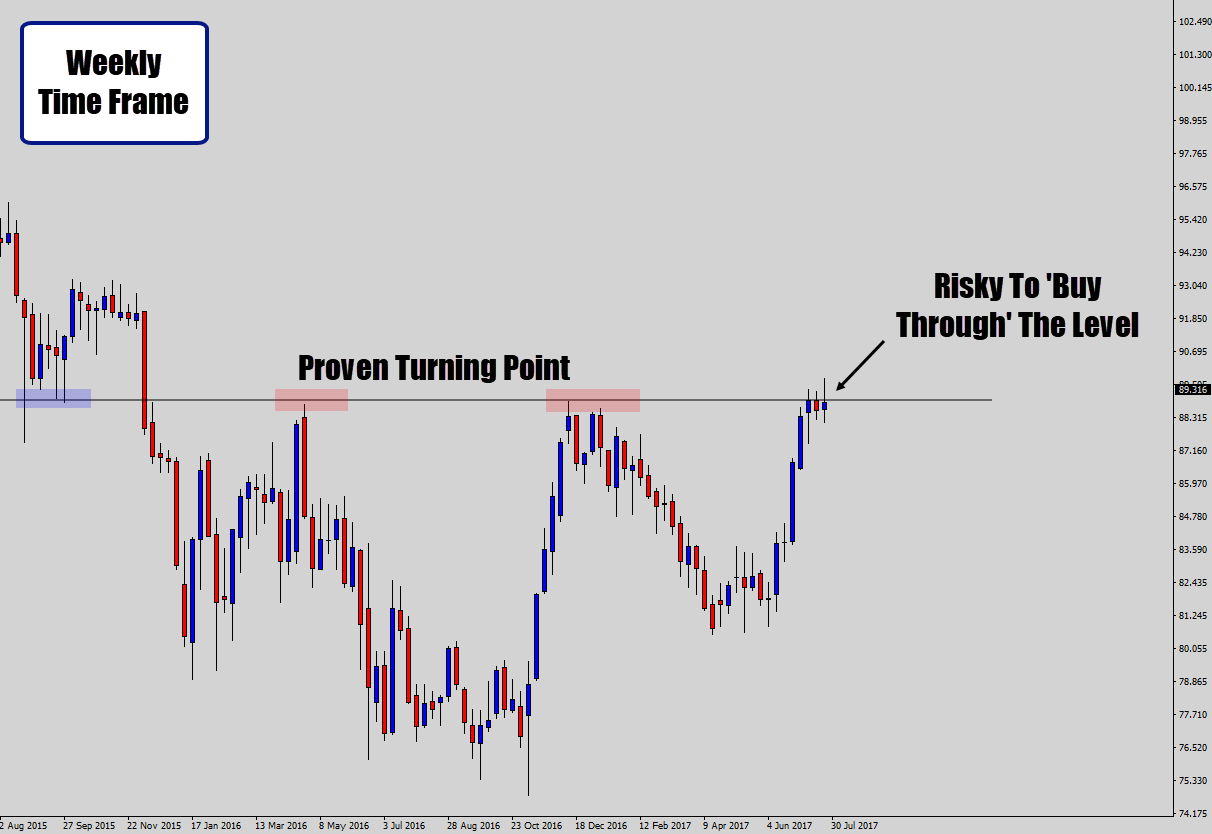
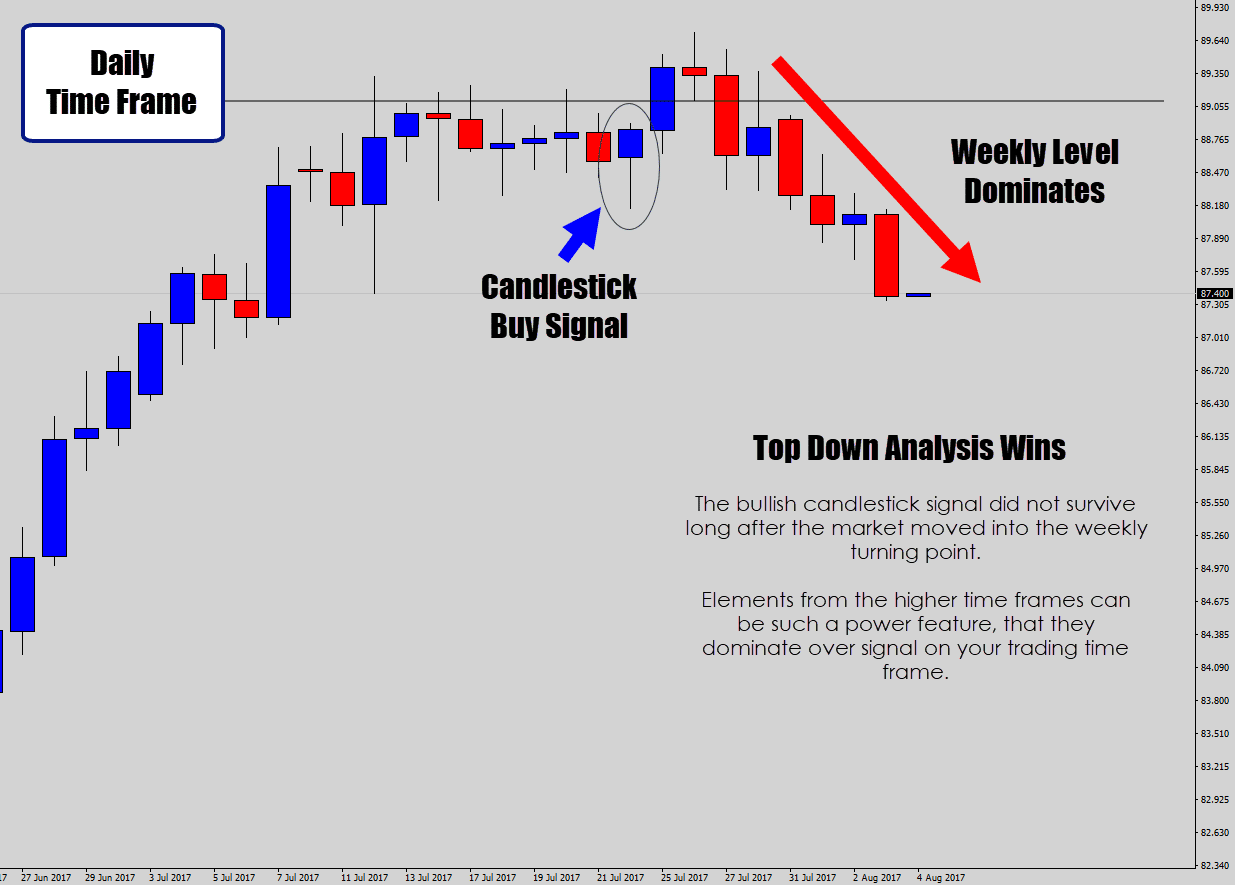
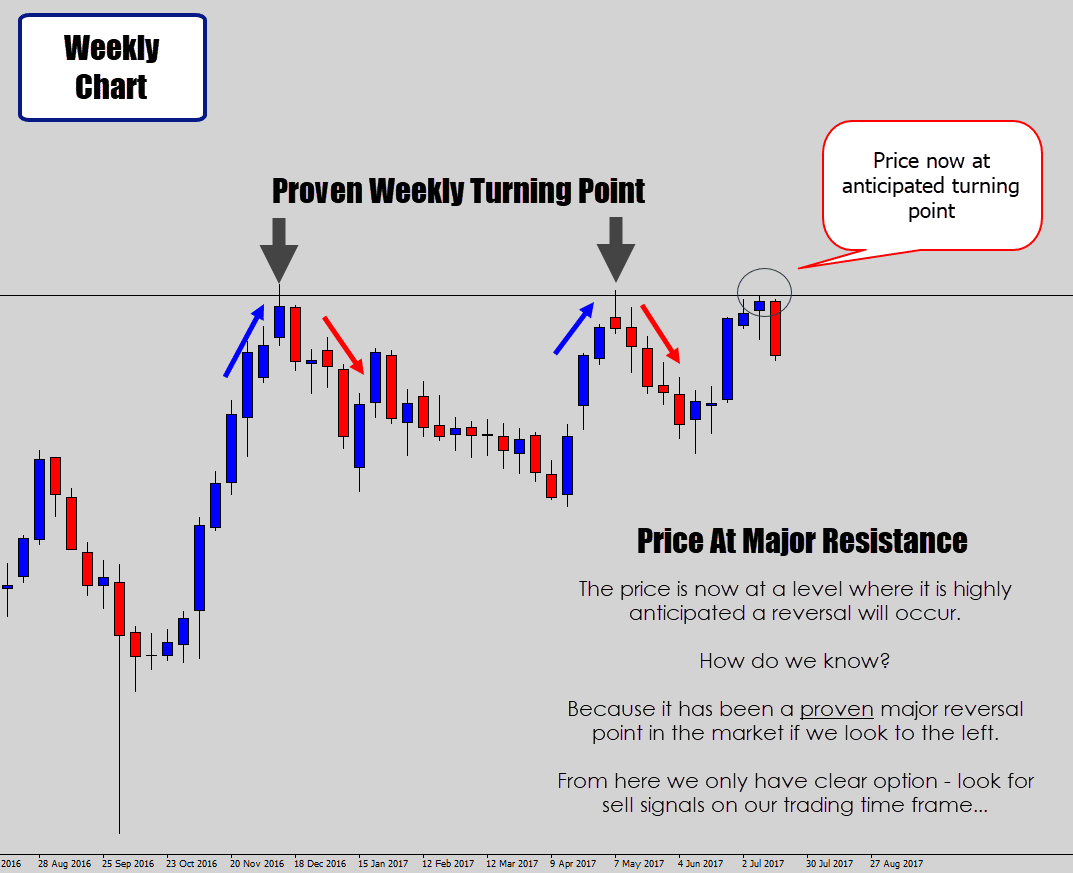
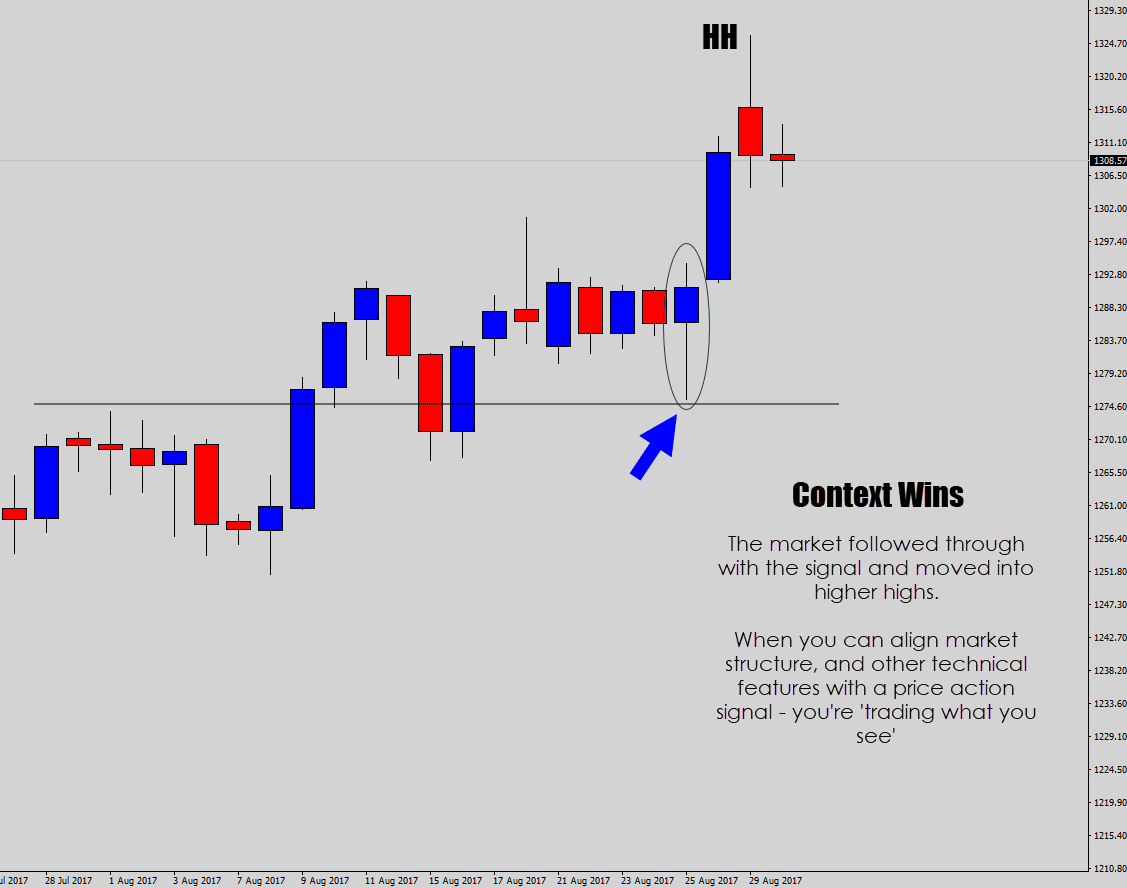
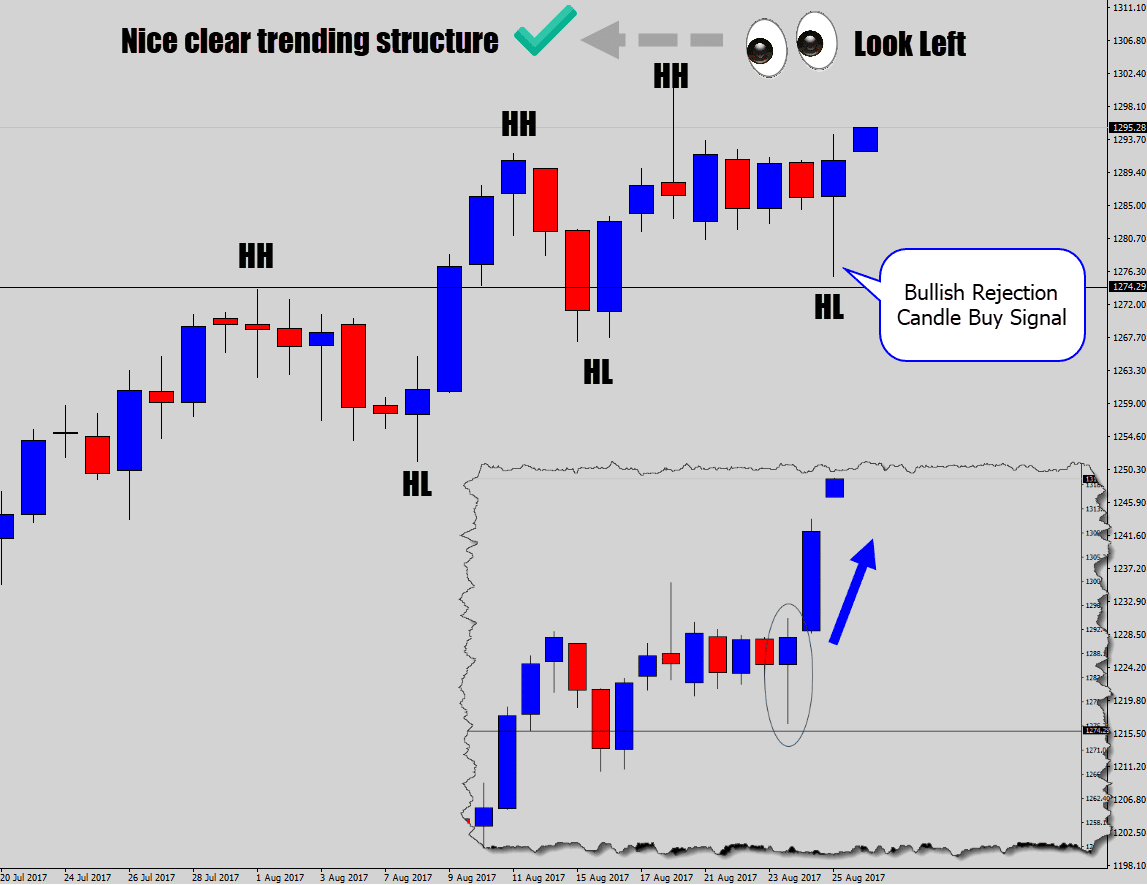
One of the quickest ‘spot checks’ you can do on your chart is have a look to the left.
What do you see? Clear trending price action, or a highly congested traffic jam?
When the market seizes up, and the flow of price action stops – we can get these horrible, hostile, churned up periods of consolidation that create ‘minefield’ like signals.
Candlestick signals, and other trades will often form within these conditions, and may be tempting to trade – but are just too unreliable in an unstable market.
There are times you would have had an experience where a trade ‘dragged you through the mud’, because you took the position in choppy market conditions.
A simple check to the left rule can be a good reminder to move on to the next chart, or wait for the next position.
Sometimes no position is a good position – especially when you’re trade is drowning in draw down.
bad price action to the left of signals
Above: A series of bullish candlestick buy signals form in rough conditions.
We take one quick look to the left, and we see the market very cluttered and congested – just like a peak hour traffic jam.
This immediately tags the signals as very risky. The unstable price action, and no clear market structure makes these types of charts very difficult to make money with.
3 out of 4 of the signals in the example above have had their low’s broken – which means they would have highly likely been stopped out.
Trades will often float between profit and draw down for days, and give you unwanted anxiety.
I just recently experienced this myself. My trade got caught in congestion for weeks, and the swap rate (interest rate) charges started to build up quite a bit.
Lets take a look at a cleaner example.
looking left to a clear trending structure
Above: Looking to the left of a bullish price action signal, we see a nice clear trending structure.
The higher highs and higher lows give a nice clear picture to the left, which builds value into the bullish trade idea.
Remember this line:
Muddy waters are best cleared when left alone.
Simply meaning, if you see bad conditions – leave the chart alone and come back when things have cleared up.
If you want to dive deeper into this topic, check out my tutorial: Learn how to trade price action in Forex without using indicators.
Checkpoint
A simple and effective way to ‘spot check’ market conditions is to look to left. If you see a readable price structure, like a trend or range  – you’re good to go. However, if you see congested, difficult to understand price action – it’s best to leave that market alone until it becomes organized again.

4. Time Your Breakout Trading Decisions Carefully

a money trap suggesting breakout traps are there to trick you
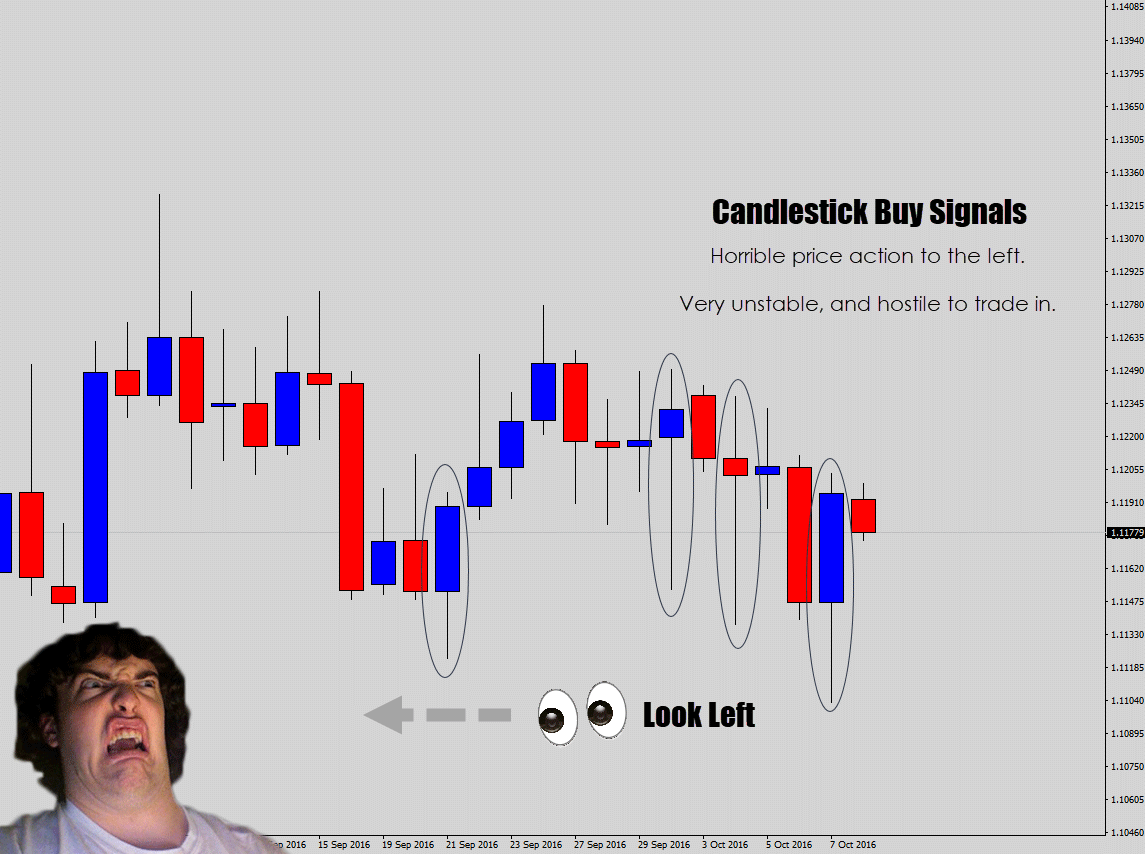
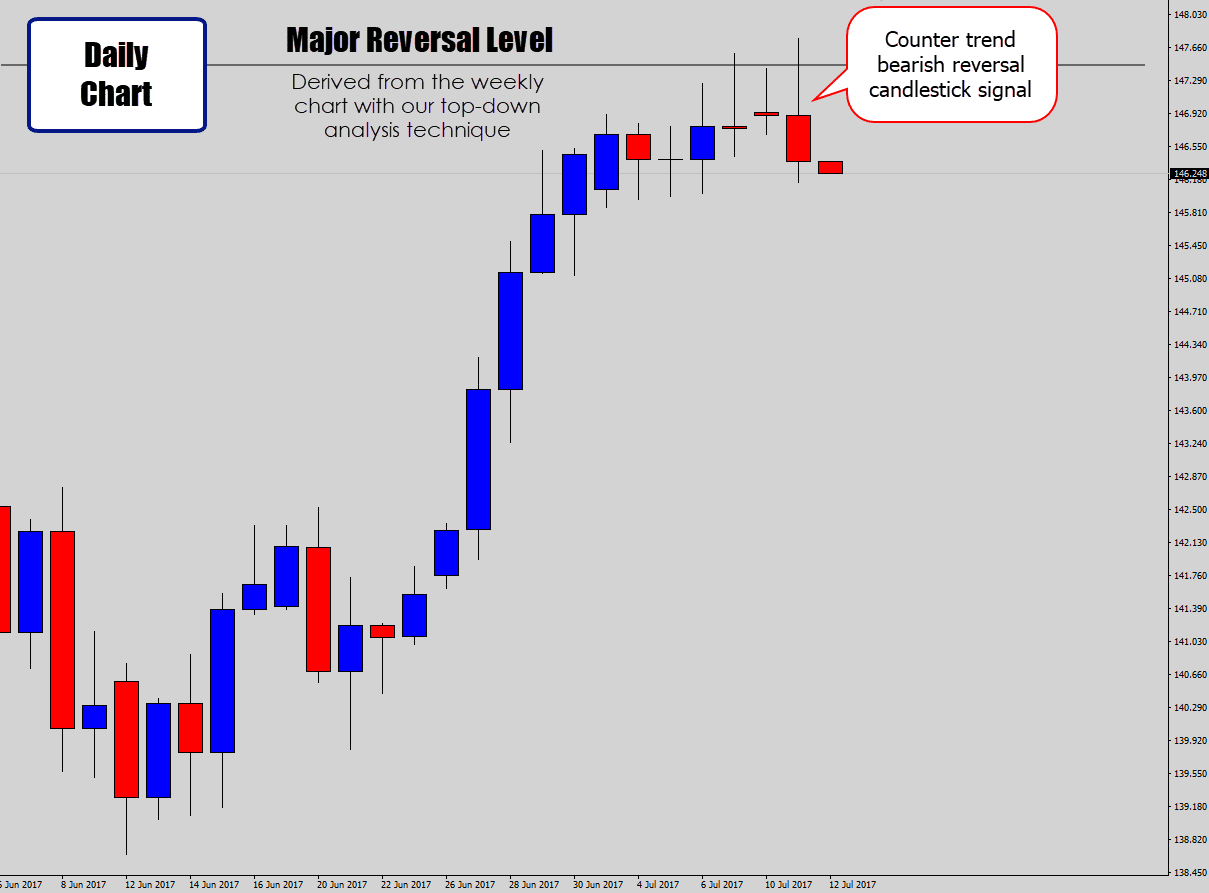
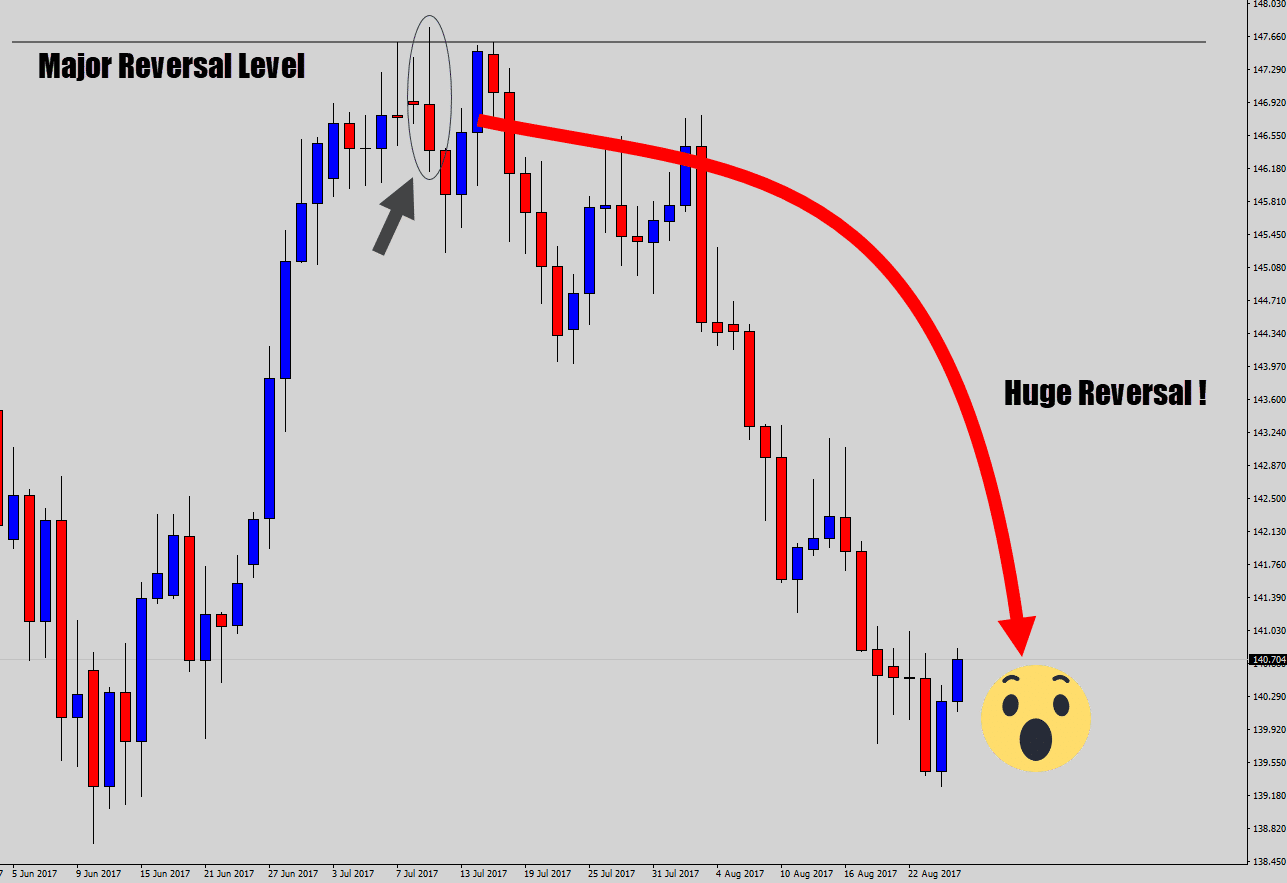
One element to a trading decision, is the timing.
I really don’t think many traders consider this, and just pull the trigger ‘in the moment’.
Depending on what time you evaluate, or make a decision to execute on a trade order – can be a ‘make or break’ factor if the trade succeeds or not.
There are many time-based nuances in trading price action, however in this segment, I am mostly focusing on breakout decisions.
Here is my industry secret…
Breakouts that occur in the Asia session are deceptive, very risky, and continue to have a high failure rate!
I speak from my swing trading experience, but this phenomenon would definitely seep into other trading strategies also.
What usually happens is this:
  • A breakout event occurs in the Asia session
  • When London opens, the breakout event has failed – then market then explodes in the opposite direction
The fix is simple. Wait until London opens before you make any breakout decisions!
If we know it’s prone to failure, then we can actually use this fakeout as a signal itself. In my opinion, this one should be left to experienced traders – but here is some food for though.
I call this kind of price event the Asia session breakout trap.
asia session breakout
Above: A price action breakout event occurs – the current daily candle breaks below the previous day candle.
In many cases, this could be a trigger for a breakout structured trade. But look what happens when we allow it to be triggered during the Asia session…
asia session fakeout
Above: The key moment for this concept. Asia session is coming to an end, and London is about to open. The Asia breakout has faded, and is building strength going into the money sessions!
This is the point of failure. This is the reason right here why I avoid the Asia breakout triggers.
If you frequently check your charts at the London open, you will see this price action event unfold many times. The London open is one of the best times to do your technical analysis, and to make your breakout trade decisions.
asia breakout fails and acts as a buy signal
Above: The initial bearish breakout is completely wiped out, and the market actually rallied in the opposite direction for days later.
That’s why we can exploit the fakeout event, and use it as a trade signal.
My theory to why this method is so powerful…
With stops being triggered, there is now less resistance for the market to move in the opposite direction due to an influx of closing trades.
This produces a very powerful ‘aftershock effect’, where price can move great distances on the chart during that session, and beyond.
The event creates an excellent opportunity for us to catch a nice explosive trade – it’s one of my favorite breakout strategies.
If you want you can trade the Asia fakeout directly, or utilize an extension of this setup – which I call the breakout trap and reverse Forex setup.
The breakout trap and reverse system is built off more confirmation:
  • First we wait for a an Asia fakeout to occur, especially around key technical areas on the chart
  • We can enter on the ‘aftershock move’ using breakout orders (buy & sell stop orders), at the opposite end of the previous candle’s range.
breakout trap and reverse trade
Breakout trap and reverse moves can be violently explosive and give you very high return on investment. But you will need to hold onto them to milk them for what they are worth.
Next time you see an Asia breakout occur, watch the price action at the London open to see what happens.
  • Is the breakout showing sustainability, and continuing to produce a nice powerful move going into London as well?
  • Or, does it collapse and cause price to charge in the opposite direction?
Checkpoint
A lot of breakouts look like fantastic trading opportunities ‘in the moment’, but [highlight]if your timing is off – you could be entering a dangerous unfulfilled move[/highlight]. These Asia breakouts collapse and trigger an ‘aftershock’ effect that fuels intense movement in the opposite direction when the money sessions open. We can capitalize on these powerful reversal moves.

Want To Learn More Secrets?

I hope today’s Forex price action tips was a good knowledge injection for you. You should be able to go to the chart now and apply these concepts immediately.
If you really enjoyed the strategies and concepts shown in the article today and are hungry for more – then you are invited to check out all the other price action articles, lessons, and video trade tutorials on my site. I am sure you will find them just as insightful.
I recommend my big price action strategy guide.
Going beyond that, I do have a price action war room that I offer for serious traders only. Without giving a sales pitch, it consists of:
  • A very comprehensive Forex price action course
  • My ‘Chart of the day‘ and weekend video market walk through
  • My custom built MT4 software
    • Price Action Battle Station (A candlestick pattern, and breakout detector + a lot more)
    • Custom Chart Builder (Build custom time frames, custom candle open/close times, Renko & Heiken Ashi charts)
    • Trade Management Panel (Quickly open trades, auto calculates risk, OCO orders, straddle trades, trailing stops + a lot more)
  • 24 hour Private Chat Room for the War Room group (share charts, ask questions etc)
If you would like to learn more about that – check out my War Room Information Page.
Again I hope you walk away from the lesson today, feeling empowered to master Forex price action. If so, please don’t forget to leave a comment below and let me know your thoughts.
Best of luck on the charts!