[Latest News][6]
#1 Live Trading on Glenmark Pharmaceuticals Ltd
#1 Live Trading on Godrej Industries Limited
#3 Live Trading Session
1-2-3 Strategy
1-2-3-4 Reversal Trading Strategy
10 CHART PATTERNS FOR PRICE ACTION TRADING
10 Habits of successful traders
10 Performing Candlesticks
10 PRICE ACTION BAR PATTERNS YOU MUST KNOW
10 PRICE ACTION CANDLESTICK PATTERNS YOU MUST KNOW
10 Things You Can Learn From The World’s Best Traders
10 TYPES OF PRICE CHARTS FOR TRADING
123 forex trading strategy
123 Trading Strategy
200 SMA
3 Bar Net Line Strategy
6 Best Price Action Trading Strategies
7 RSI TRADING STRATEGIES
9 Advanced & Profitable Trading Strategy
9 Funny Facial Expressions
AB = CD Price Action Strategy
Abb India Limited
Aditya Birla Nuvo Limited
Aditya Birla Nuvo Ltd
ADVANCED REVERSAL STRATEGY
Alice Blue Opening Link
Alphabets
Amaraja Battries
Ambuja Cement
Anupam Rasayan India Limited IPO
Asian Paint Ltd
Aurobindo Pharma Limited
Bajaj-Auto
Bearish Crossover
Bearish Engulfing
Bearish Engulfing Candle
Bearish Reversal (Red-Red)
BEML Ltd
Best Stock Market Strategy
Bharat Finance Inclusion
Blood Rain Pattern
bollinger band
Bollinger Band Price goes below Mid line Strategy
Bollinger Band Price gone above mid line
Bollinger Band Strategy
Breakout Stock Trading Strategy
Bullish Crossover
Bullish Engulfing
Bullish Gartley Pattern Strategy
Bullish Three Bar Reversal
Butterfly Spread
Cadila Healthcare Limited
Calendar Spread
Camarilla Equition
canara Bank
Candlestick Charts
Candlestick Patterns
Candlestick Patterns Strategy
Cesc Limited
Chart Patterns
Cipla
Closing Above Previous High for 3 Days
Closing Below Previous Low For 3 Days
coal India
Cup & Handle Pattern
Daily Life of a Trader
dark cloud cover
Day Trading Breakout
Day Trading Setups
Day Trading Setups – 6 Classic Formations
Day Trading Strategy
DBLHC
Descending Triangle
Divergence Price Action Strategy
DIVI'S Laboratories Ltd
Doji Candlestick Patterns
Dojis
Double EMA
Dr Reddy
Dr. Reddy's Laboratories Limited
Early Morning Range Breakouts – 4 Trading Strategies
EMA
Equity Market
EXHAUSTION BAR
Falling Wedges (26th Dec 2017)
Federal Bank
fibonacci
Fibonacci Retracement
Fibonacci Retrenchment Strategy
Fibonacci swing trading strategy
Flag Pattern Strategy
Flash Pattern
Forex Trading Strategies
Fyers Account
Gandhi Jayanti
Gap Up
Gartley Pattern
Glenmark Pharmaceuticals Limited
godrej
Godrej Consumer Products Limited
Godrej India
Gppl
Happy Birthday
Happy Chhath Puja
Happy Diwali
Happy Diwali (2017)
Happy Diwali (2018)
Happy Dussehra
Happy Ganesh Chaturthi
Happy Holi
Happy Independence Day 2017
Happy Janmashtami
Happy Krishna Janmashtami 2017
Happy Muharram 2017
Happy Navratri To All
Happy Teacher Day
Harmonic Pattern
HCL Technology
HDFC
HDFC Bank
Head & Shoulders breakout
Head & Shoulders Pattern (6th Oct 2017)
Head and Shoulders Pattern
Higher high of 3 days
Hikkake Pattern
Hindustan Petrolium
Hindustan Unilever
Hindustan Unilever Limited
HOW TO DRAW TRENDLINES
How To Trade Supply And Demand
IndusInd Bank
Indusind Bank Ltd
Infosys
INSIDE BAR
Inside Bar - Outside Bar
Inside Bar Trading Strategy by Stock Alphabets
Inside Day Bar
Intraday
Intraday strategy
Intraday strategy with Camarilla Equition
intraday SureShot
Intraday SureShot Official Post
Intraday Trading Strategy
Intraday/Day Trading Strategy
inverted Head & Shoulders
Irb Infrastructure Developers Limited
Iron Condor
Iron Fly
Island Reversal Pattern Trading Strategy
Jindal Steel & Power Limited
Jk Lakshmi Cement Limited
Jubilant Food
Jubilant Foodworks Limited
Kajaria Ceramics
KEY REVERSAL BAR
Kingfa Science and Technolgy (India) Ltd
Kotak Mahindra Bank Limited
Larson & Tarbo
LIC
LIC Housing Finance Limited
Live Trading
Lupin Limited
M & M Finance
Mahanagar gas
Making Higher High for 3 Days
Making Lower Lows for 3 Days
Master Candle
Master Candle Strategy
Master Plus Candlesticks
Meditation
Mind Tree
Mindtree
Mobile App & Website for share market
Momentum Divergence Strategy
Morning and Evening Stars
Moving Average Strategy
My 10 price action secrets
Naked Options
NBCC (India) Limited
New Mobile Application Annoucement
NHPC
Nifty Trend (12th August 2017)
Nifty Trend line (10th August 2017)
NMDC
NMDC Cup & Handle Pattern
NR7
NTPC
Nureca Limited IPO
Option Strangle (Long Strangle)
Options Strategy Newsletter
OUTSIDE BAR
Outside Bar-Inside Bar Combo Pattern
Pattern Strategy
PATTERNS
Pidilite India
PINOCCHIO BAR (PIN BAR)
PINOCCHIO BAR TRADE SETUP (PIN BAR)
Piramal Enterprises Limited
planting trees
PNB
POPGUN BAR PATTERN
Price action
Price Action Candlestick Patterns
Price Action Continuation Patterns
Price Action PATTERN # 6: Pin Bars
PRICE ACTION PATTERN #1: DBLHC
Price Action PATTERN #4: BEOVB
Price Action PATTERN #5: BUOVB
Price Action Patterns
Price Action Pivot Point Strategy
Price Action Sandwich Trading Setup
Price Action Strategy
Price Action Strategy Guide
Price Action Strategy lover
Price Action Trading Class
Price Action Trading Course
Price action trading strategy
Price came back channel from bottom
Price came back channel from Top
Price gone below mid line
Price-action-trading-strategies #Chapter-01
Price-action-trading-strategies-#Chapter-02
price-action-trading-strategies-#Chapter-03
Price-action-trading-strategies-#chapter-04
Profitable Level
Profitable Level (13th Dec 2017)
Profitable Level (14th Dec 2017)
Profitable Level (15th Dec 2017)
Profitable Level (18th Dec 2017)
Profitable Level (18th Sept 2017)
Profitable Pattern
Profitable Trader
Profitable Traders Do Nothing 99% Of the Time
PVR
RailTel IPO
Ratio Spread
Raymond Limited
Reliance Capital
Reliance Infra
Repco Home Finance
REVERSAL BAR PATTERN
Risk/Reward
Ross Hook Pattern Trading Strategy
RSI
RSI Divergence Strategy
SBI
Shooting
Six Candle Concepts
SMA
Sodha
Spring at Support & Resistance
State Bank of India
Stock Alphabets
Stock Market
Stock Market & Finance Movies
Stock Market Strategy
StockAlphabets
Stop Loss Order
Straddle
Strangle
Strategy EMA
Strategy Resource
Strip/ Strap
sun Pharma
Sun Pharmaceuticals Industries Limited
Supertrend
Supertrend Strategy
support & Resistance
Support & Resistance (25th Sept 2017)
Support & Resistance (26th Dec 2017)
Support & Resistance Strategy (6th Dec 2017)
Support and Resistance
Swerve pattern
Swing Trading Strategies
Swing Trading Strategy
Tata Chemical
Tata Global Beverages
Tata Motors
TCS
The Best Stocks to Buy Now or Whenever
The India Cements Limited
The Outside Bar Trading Strategy
Three Bar Reversal
Three Candle Formation
THREE-BAR PULLBACK
Titan Company Limited
Top Indian Companies with Monopoly
Top 10 Continuation Candlesticks
TOP 10 PRICE ACTION TRADING BOOKS
Top 10 Reversal Candlesticks
Top Monopoly stocks in India
Torrent
Torrent Pharmaceuticals
Traders Trick Entry Trading System
trading breakout
Trading Key Reversal Bar
Trading Psychology
Trading Strategy
Trading Strategy For Posstional & Intraday
Trading System
Trading the trend
Trend line (25th Sept 2017)
Trend line Strategy
Trend line Strategy (14th Dec 2017)
Trend Trading Analysis Prediction
Trend-line Strategy (30th Nov 2017)
Trendline
Trendline (19th Sept 2017)
Trendline (6th Nov 2017)
Trendline Line Strategy
Trendline strategy
Trendline Strategy (19th Dec 2017)
Trendline Strategy (2nd Dec 2017)
Trendline Strategy (6th Dec 2017)
Triagle Pattern
TV18 Broadcast Limited
TWO-BAR REVERSAL
Types of Trader
TYPICAL PRICE
Typical Price Action Strategy
ubl
UBL Breakout
Ujjivan
Ujjivan Financial Services
United Breweries Limited
United Phosphorus Ltd
Vertical Spread
Volume Candlesticks
Volume Trading Intraday Strategy
W Pattern
Wedge Pattern Strategy
Wedges Price Action Strategy(16th Dec 2017)
wedges Strategy (19th Dec 2017)
Wipro Limited
Wockhardt Limited
Wolf Wave Strategy
World’s Best Traders
www.StockAlphabets.com
Yes Bank
Zee Entertainment Enterprises Limited
Zydus Wellness


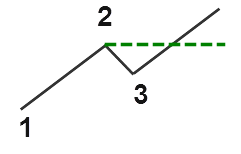


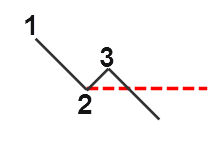
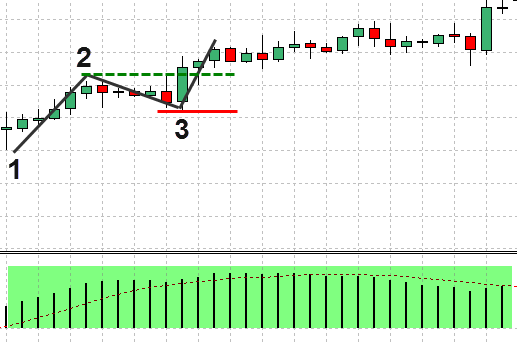
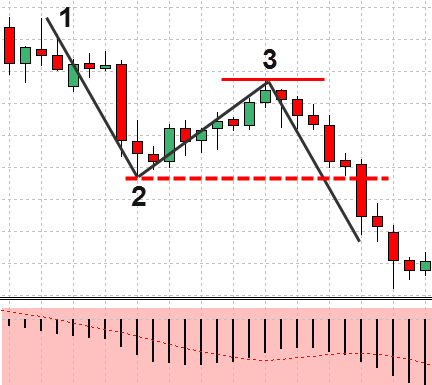
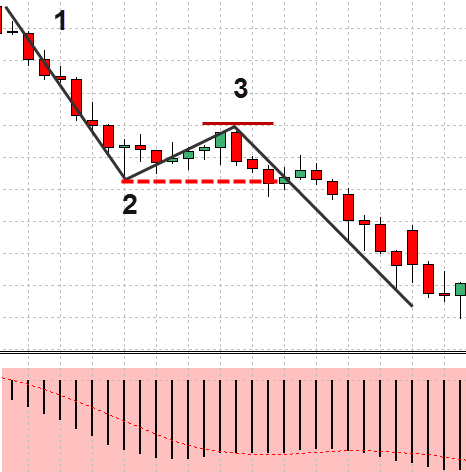
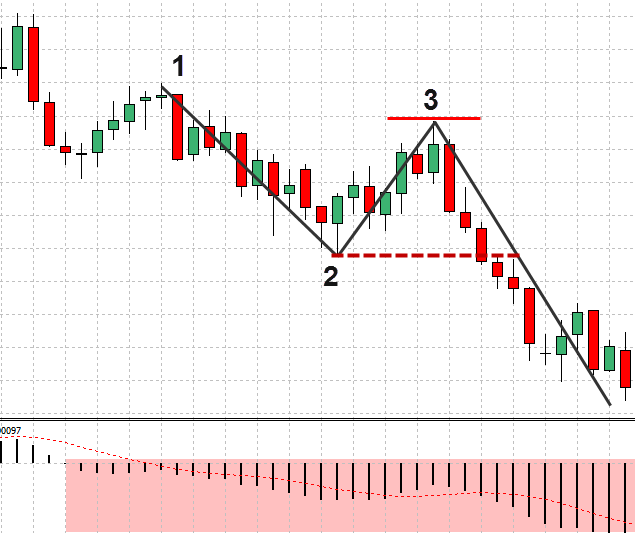
 Apply the 1-2-3 pattern.