


 In today’s article, I am going to kick off my new series on Forex strategy analysis.
That’s where I take trade ideas, concepts, or strategies out there in the Forex wild, do some data mining, show some cool graphs, hunt for correlations, and try spot any statistical hot spots we can exploit for $$$.
Basically does the strategy work or not? If so, where is it working, and where is it not?
If the data demonstrates some statistical edges, we run the strategy through a trading robot back test to simulate how they would perform.
Since this is my first candlestick pattern strategy evaluation, I wanted to focus on something really really simple – the candle body.
🤔 Does the candle body thickness have predictive powers? Can it give us an edge?
Let’s dive in and do some deep, but fun analysis on the candle body’s secrets.
The Candlestick Body “Chart Pattern” Strategy Explained
Quite a few years ago, browsing a Forex forum – I came across a group of price action traders who only used the candle body to make a trading decision.
- If a candle closed bullish: they were long
- If a candle closed bearish: sells were opened
This kind of strategy seems really stupid simple, and probably is one of the simplest candlestick strategy ideas out there.
Trading the strategy with such simple rules would straight up, not work at all – the success would be very hit and miss depending on market volatility.
This concept is missing one thing, some quality control. The market is not going to just let you profit off the direction of the candle close in the long run.
For example; Imagine using these rules in heavy consolidation, you would be flipping trades every day with building frustration.
But, there may be some merit to the idea if we introduce some other metrics and rules.
The theory goes like this: When you see a candle with a large, thick body – you generally do see good follow-through from price in the same direction.
A picture says it all… here is an overview of the success condition we are trying to measure:
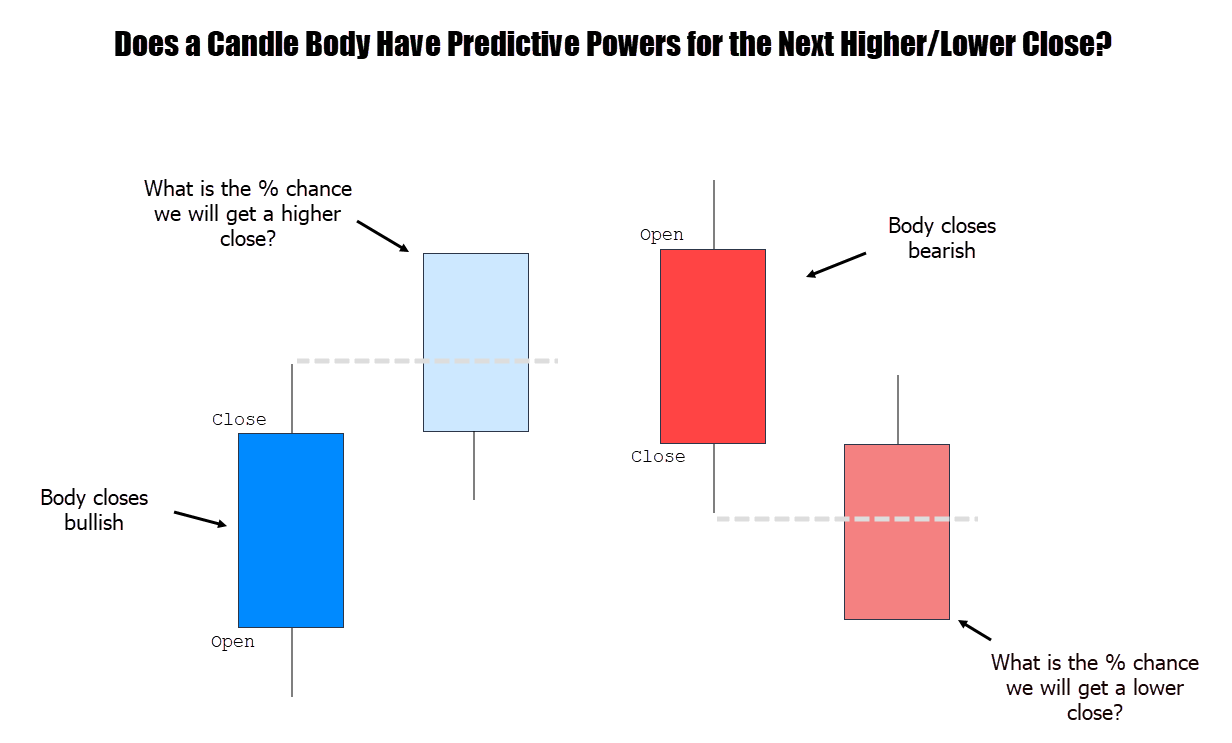
Basically we want to know if a candle closes with a bullish body, what is the percentage chance we will see a higher close before a lower close.
Our stop loss for the experiment will be placed at the opposite end of the candle.
In other words, to be considered a bullish signal success, a candle must close past the ‘signal candle’ high before a candle breaks the opposite side.
Invert those rules for bearish conditions.
If a candle closes bearish, what percentage chance are we likely to see the lower close first.
Candles closing inside the ‘signal’ candle’s range are are ‘null’ event. We wait for either that explicit higher close, or lower close (past the signal candle’s range).
Lets check out how that looks in theory on the charts…
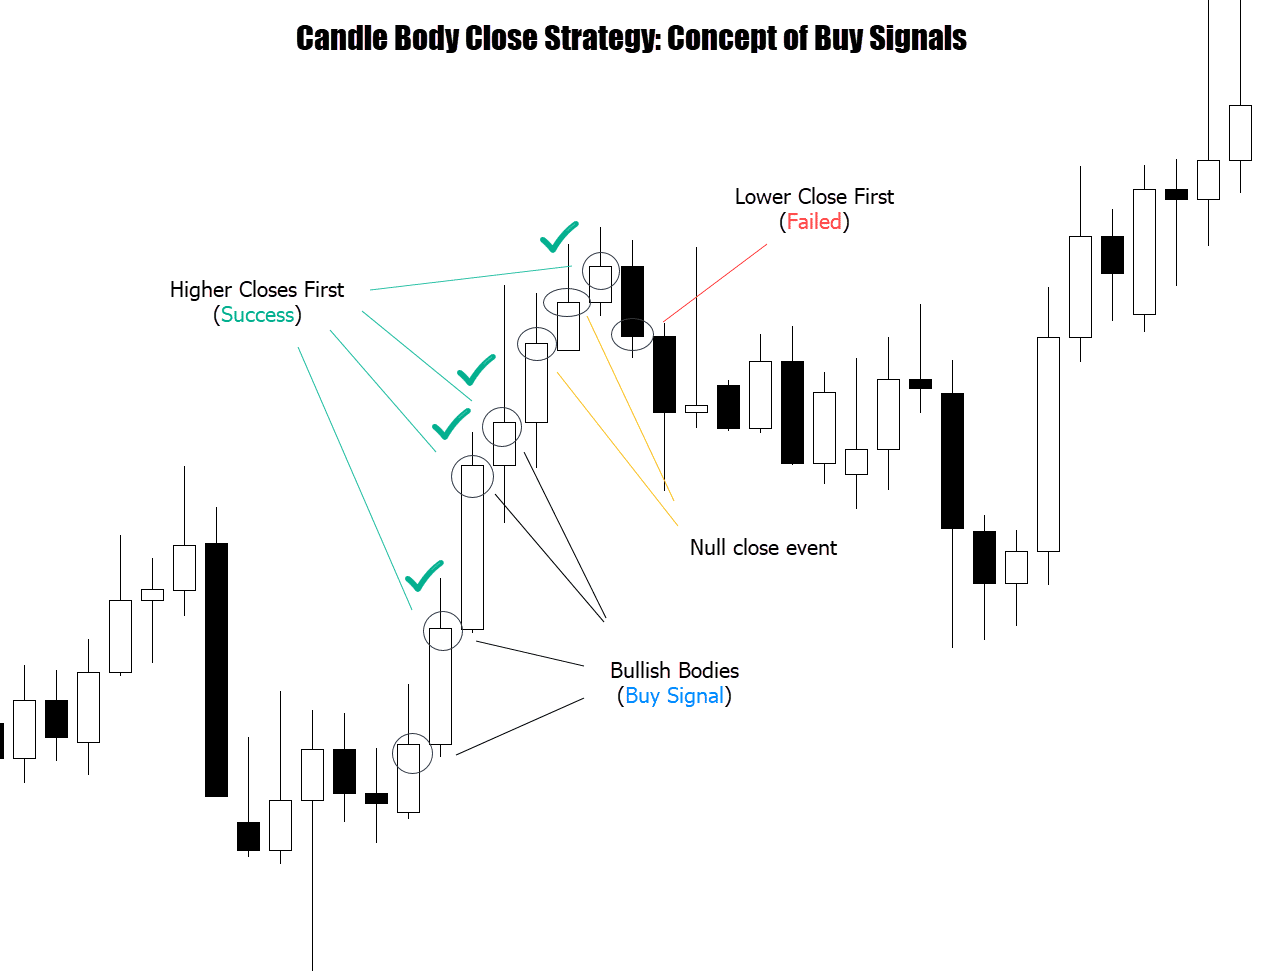
Above: In a bull run, this idea would thrive. A nice stack of bullish bodied candles would create a burst of lucrative trading.
The same goes for bearish runs…
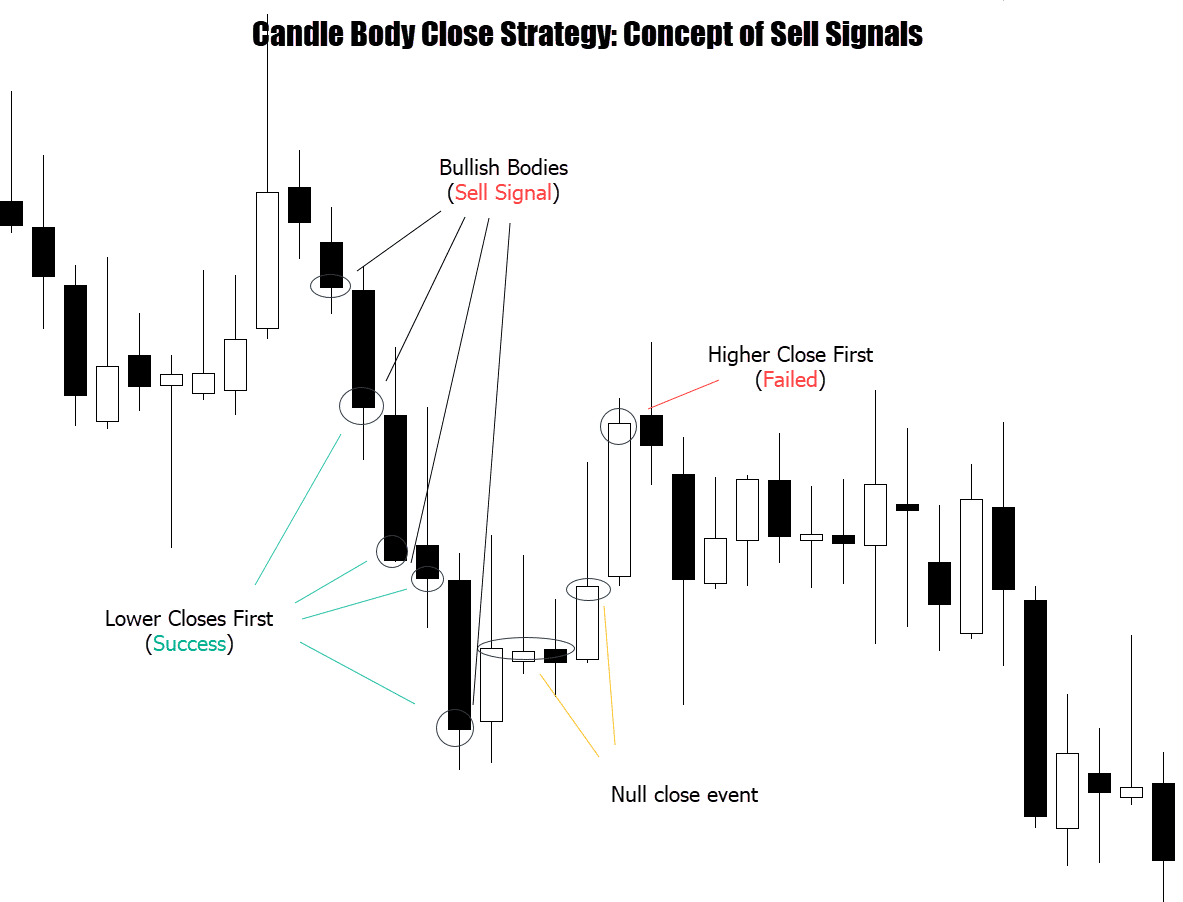
A nice bearish waterfall would bring the profits up quickly.
But these are the text-book conditions for this strategy. How often can we expect these ‘picture perfect’ scenarios to pop up, and when are we going to know they will happen? – we don’t.
We can’t rely on being carried by a huge market rally every day.
That’s why it is important to start introducing some quality control metrics to be able to filter the good from the bad!
The Size of the Candle Body
 One of the obvious, first measurements we can observe is how the candle body’s size effects the success / failure of the signal.
The body size should be a big deal – imagine a small doji candle vs a big thick bodied power candle. The difference between the two (I would imagine) would be quite dramatic – but you never know…
But what are we going to compare it with? We can’t measure body size against a hard set number, like body size compared to 300 pips.
The average trading range between markets changes dramatically. Gold can move 2000 points a session, making the static pip measurement a bogus reference.
But ahh… the Average Trading Range (ATR)!
We can measure the candle’s body size against the current Average Trading Range’s value.
That way we have a relative metric to measure the body size against which adjusts to market conditions.
If the market is pushing out some big candles, then the ATR will scale up and also scale down in slow conditions.
I decided to measure the candle’s body size vs the ATR as a percentage. Let’s consider the ATR was 50 pips:
- If the candle body measured 50 pips, then the percentage would be 100%. Because the candle body is 100% the size of the ATR
- If the candle body measured 25 pips, that’s 50% of the ATR
- If the candle body measured 80 pips, that’s 160% of the ATR – representing a candle body that is larger than the current volatility
Alright so lets show some graphs.
Below is a success/failed histogram which illustrates the data with clarity.
The x-axis shows how the body size Vs ATR (20 period) affects the signal performance. Here is an example…
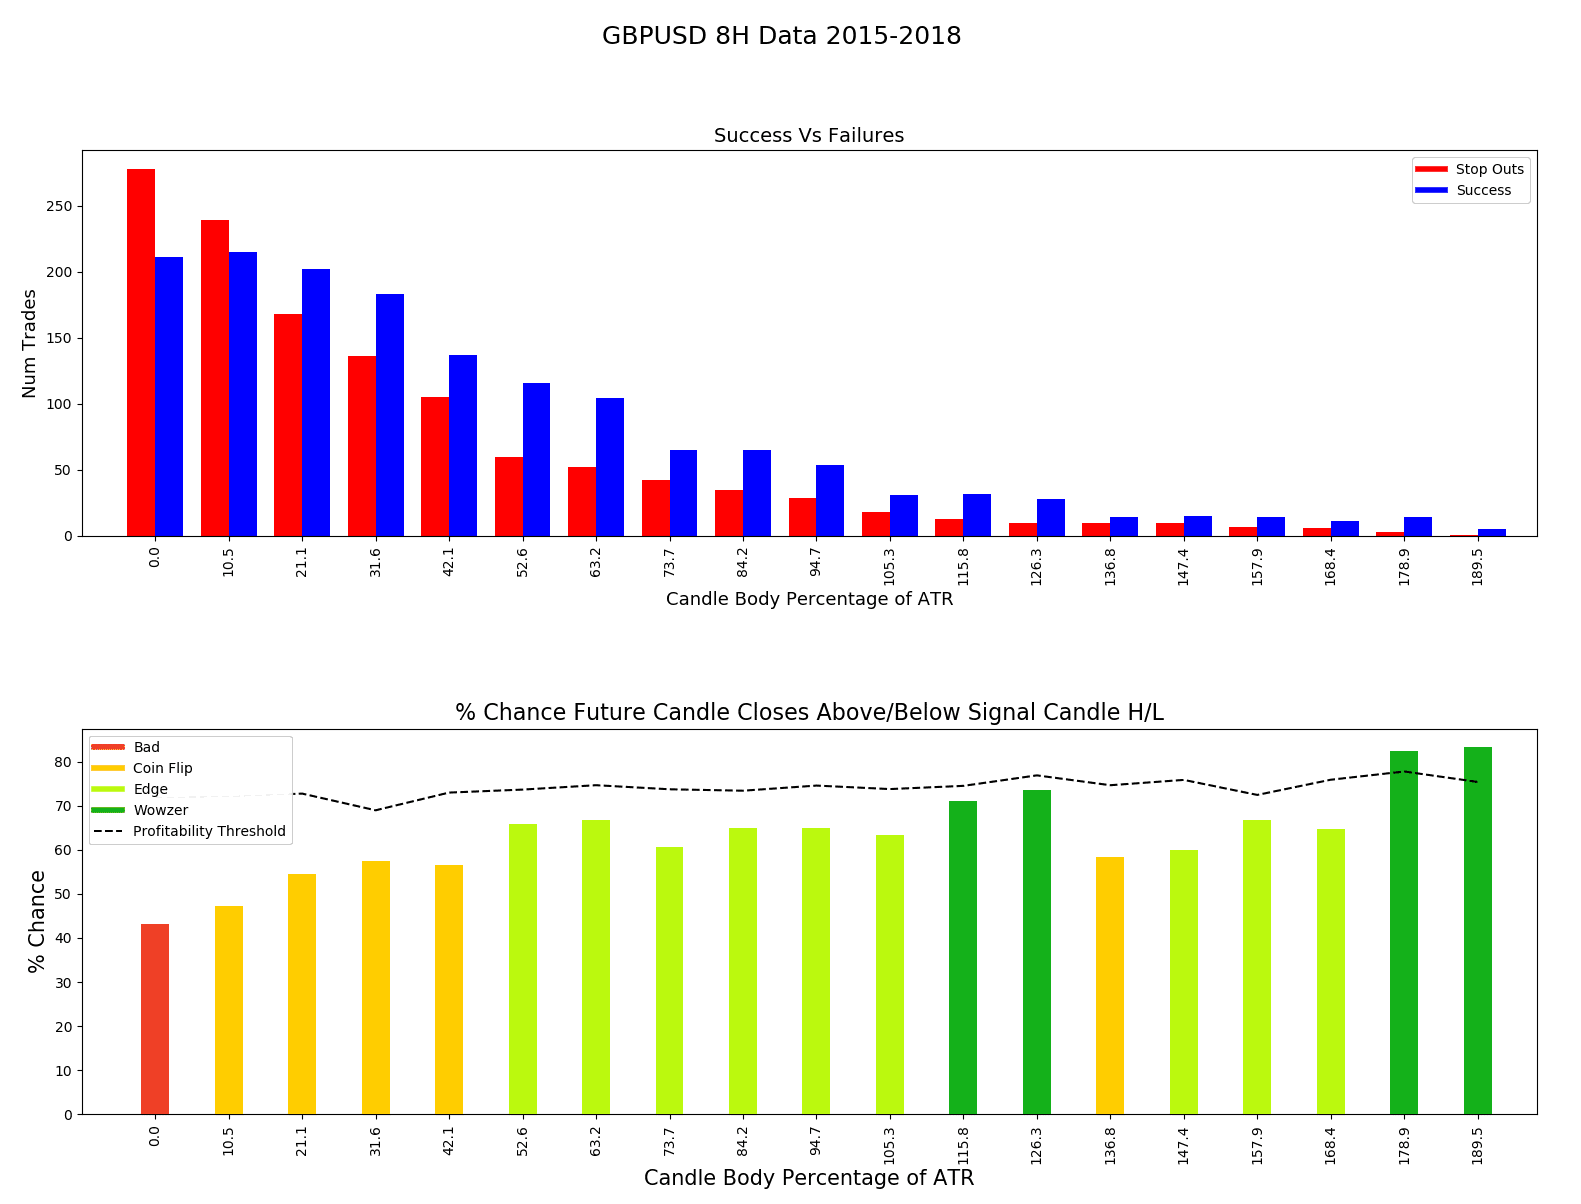
The bottom graph is my nicely color coded ‘probabilities histogram’ showing us where the strong advantages are in the data (if they exist).
Going by this graph, it seems there is a clear edge when the body size is above 85% of the ATR. However, if we look at the success/fail histogram above, we can see there are not many trades above 130%.
So the opportunity seems to be between 85-120% of the ATR.
But I’ve also added another observation on the chart, which is the ‘profitability threshold’.
When the bars are above the threshold, the system as a chance to do make money – the further above the line, the more likely it is to make money over the long term.
It uses the average return on risk for each bin range on the x-axis to establish how each x value range (the body size of the candle vs the ATR) affects profitability.
This example chart doesn’t look healthy, with most bars falling below the profit line (you can also think about this line as a ‘break even marker’).
Wait! Don’t throw down the hammer and make conclusions just yet – this is only the GBPUSD… there are many other markets to run the data on. Not only that, this is the 6 hour time frame – what about the other time frames?
I decided to include most of the swing trading time frames:
- 1 hour
- 4 hour
- 6 hour
- 8 hour
- 12 hour
- Daily
I also threw in the 15 min chart to satisfy the high frequency junkies (day traders) out there. I personally hate those lower time frames, but I will let the data do the talking..
For markets to run this strategy on, I picked a handful of different markets to save time on the data mining process (I would be here forever processing every single market & time frame variant).
- EURUSD
- GBPUSD
- AUDUSD
- EURJPY
- GBPNZD
- AUDNZD
- EURGBP
- GOLD
- Crude Oil
- S&P
Every Forex strategy will perform differently on individual markets. A strategy could be a big winner on EURUSD, but wipe an account on GBPNZD.
This spread of market will provide a nice variety, and a good idea on how the strategy performs across our ‘test basket’ of markets for a ‘general performance’ metric – we can always test on more instruments if the results are promising.
So let’s look at some graphs …
Raw Candlestick Body Size Vs ATR Performance
To avoid bloating the article with 100’s of graphs, we can consolidate data groups together to see if any nice metrics pop out at us. If they do, we can get more granular.
As I mentioned before I included the 15 min time frame… so lets start from the bottom.
Not expecting much magic from this low time frame data to be brutally honest with you.
Below is the consolidated 15 min data of all the test symbols to highlight the candlestick pattern strategy performance across the board.
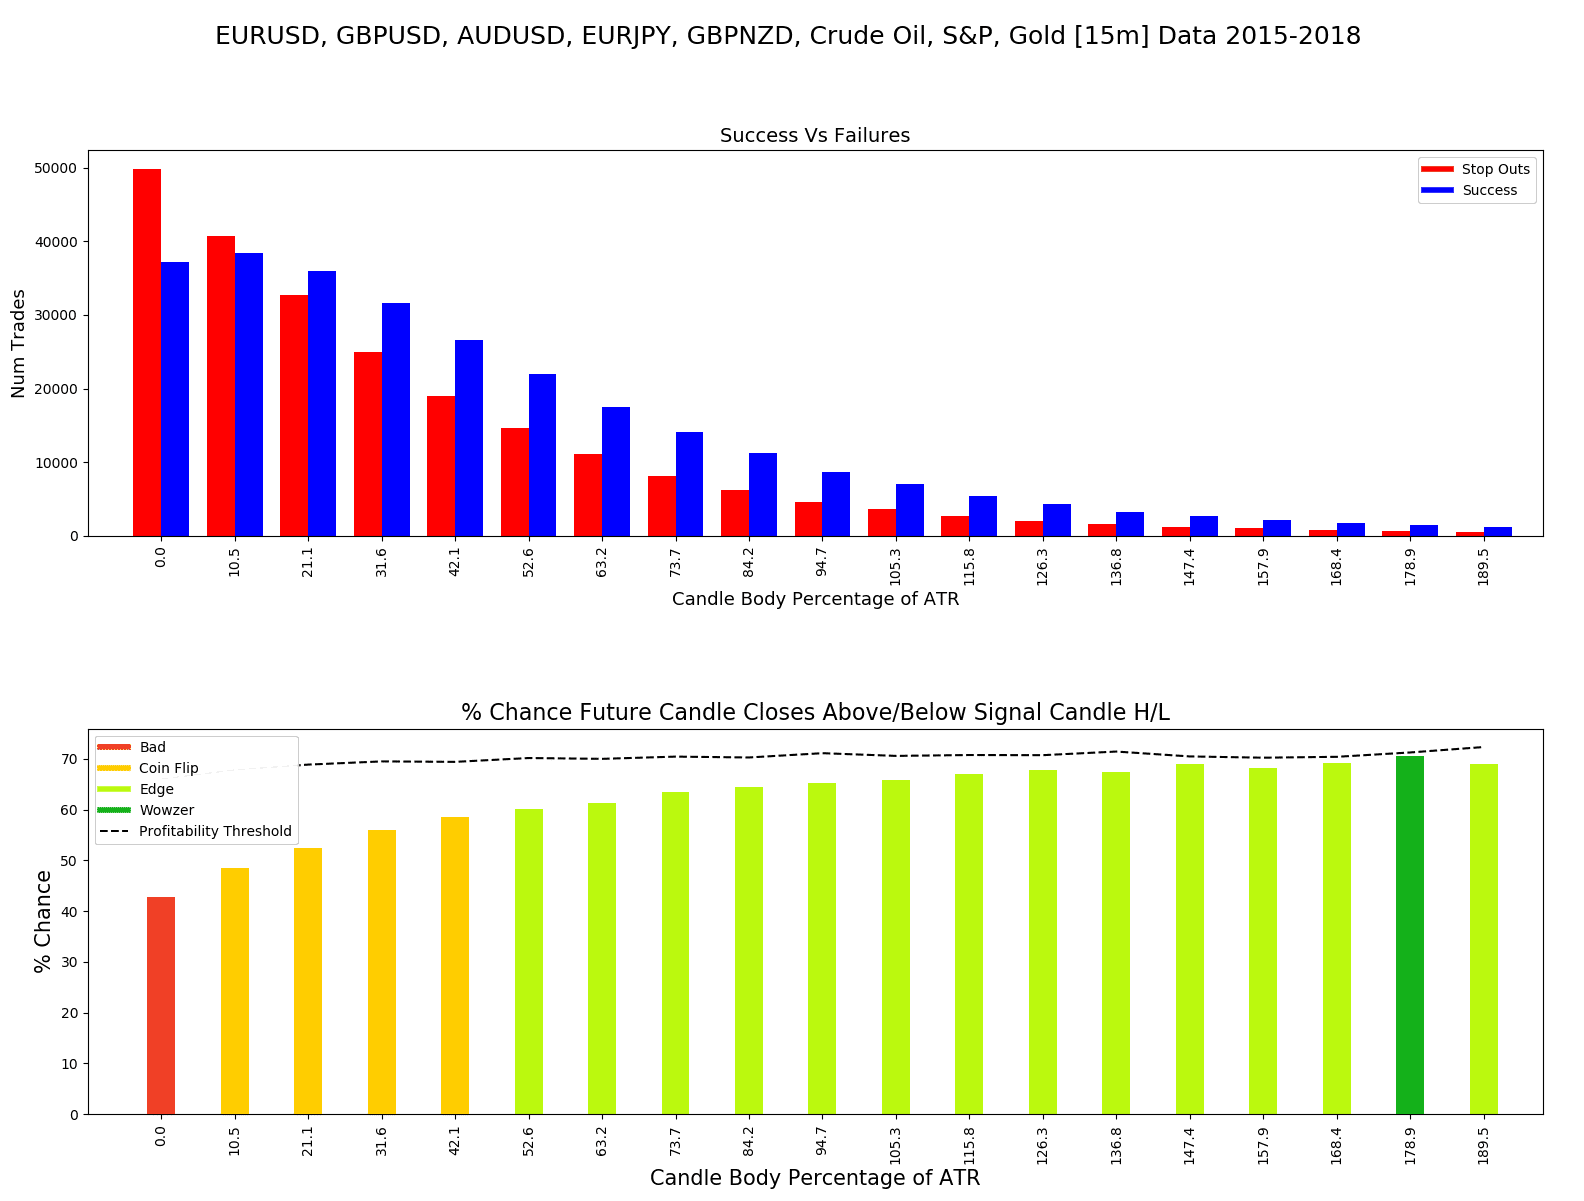
As expected a poor result.
None of the candle body sizes are able to make it over the profitability line.
One correlation visible here is that the success chance increases as the body size of the candle gets higher.
You might be thinking: “Wait I see 60-70% win rates”. That’s true, the trades are hitting the ‘success condition’ frequently, but the reward is poor vs the risk taken.
Meaning each failed trade becomes very punishing to the system.
What about the 1 hour ?
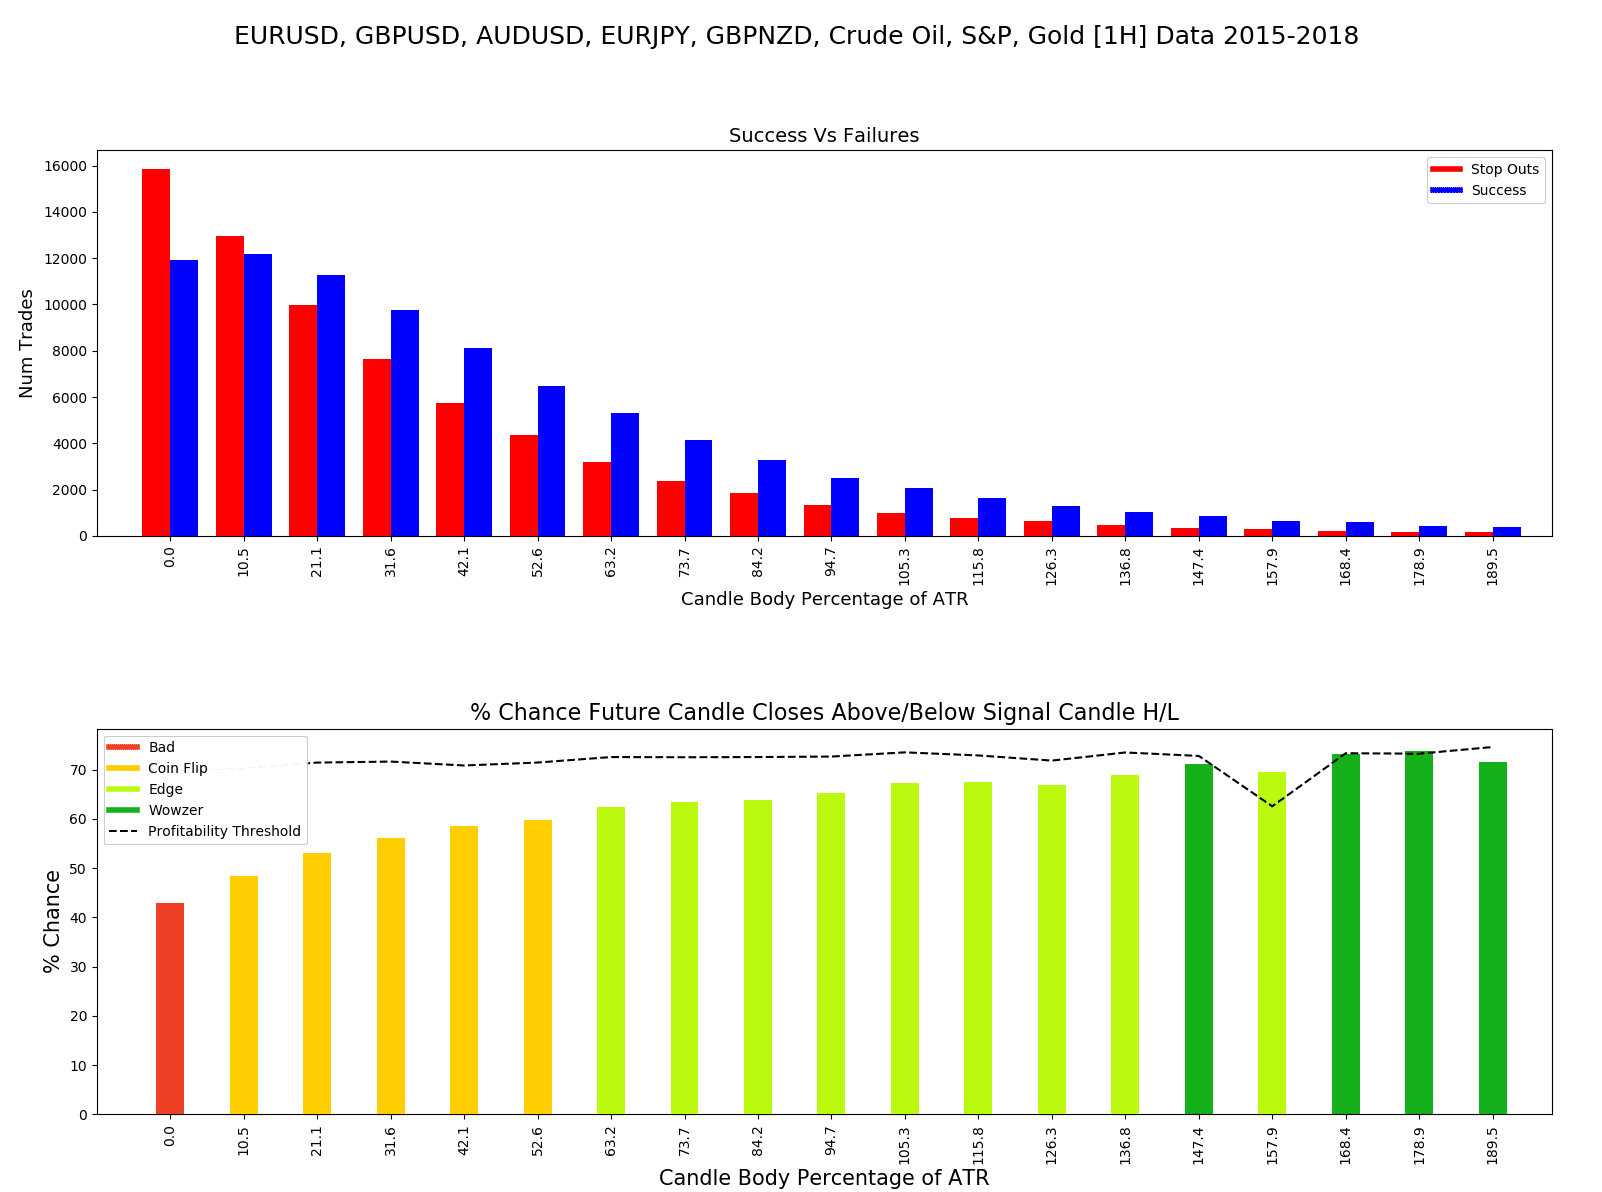
Not really much going on for 1 hour either.
The 1 hour chart is not easy to trade anyway, the candles still don’t have much price action data within them.
Stepping it up a notch to the 4 – 6 hour range…

Only negligible improvements.
The candle body really needs to be 135% of the ATR to be able to flirt with the break even mark.
Finally, my favorite swing trading time frames – the 8H to daily charts…

Honestly I thought we would see some improvement here, however this data is really disappointing too.
The best of the worst seems to be the 4-6 hour range when the candle body is above 115% of the ATR.
For fun, lets run through a few back test results, and observe how the equity curve looks like on that data range.
Starting from the bottom, here at some 15 min time frame results…
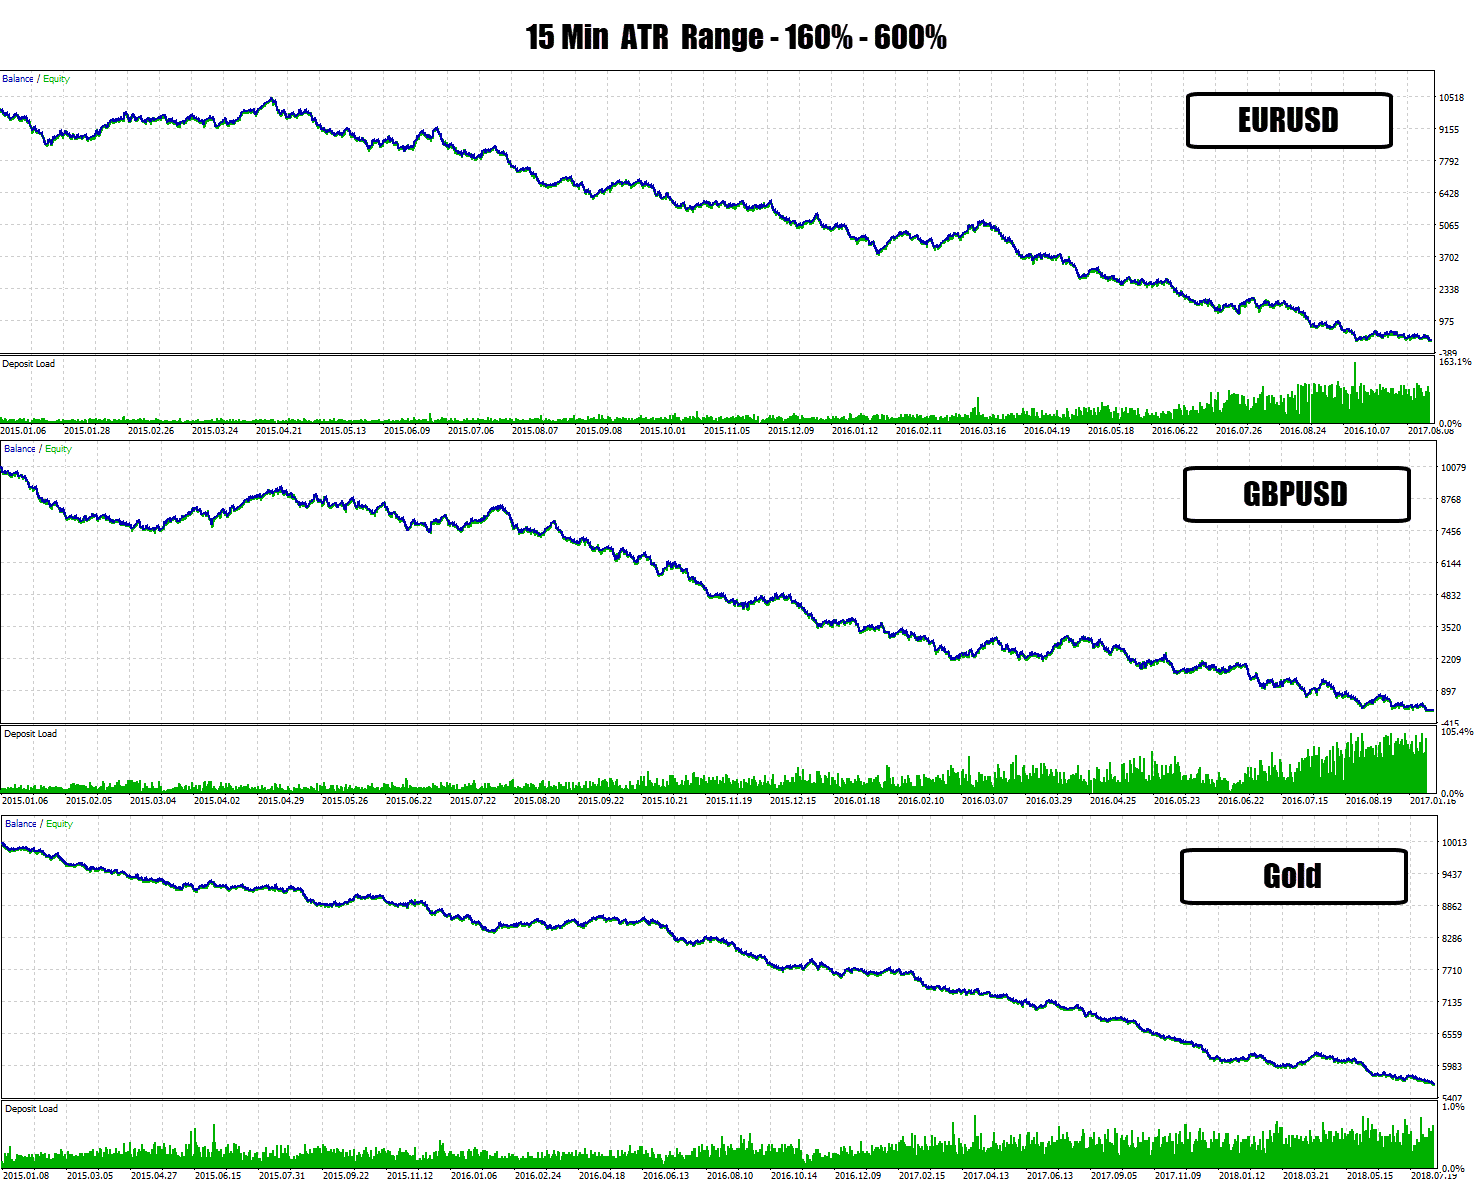
Setting the minimum candle body size of 160%, as that was the only range that came close to the profitability line on the performance graphs.
As you can see the 15 min chart results would have brought tears to a grown man’s face if you let this system run on your live account.
Total trash results. The performance graphs shown earlier anticipated this.
Moving along to some 6 hour time frame figures. I am not showing every single symbol otherwise the article will be too bloated.
The min ATR was set to 115% this time, as the performance evaluation charts showed this is were the best performance started to kick in.
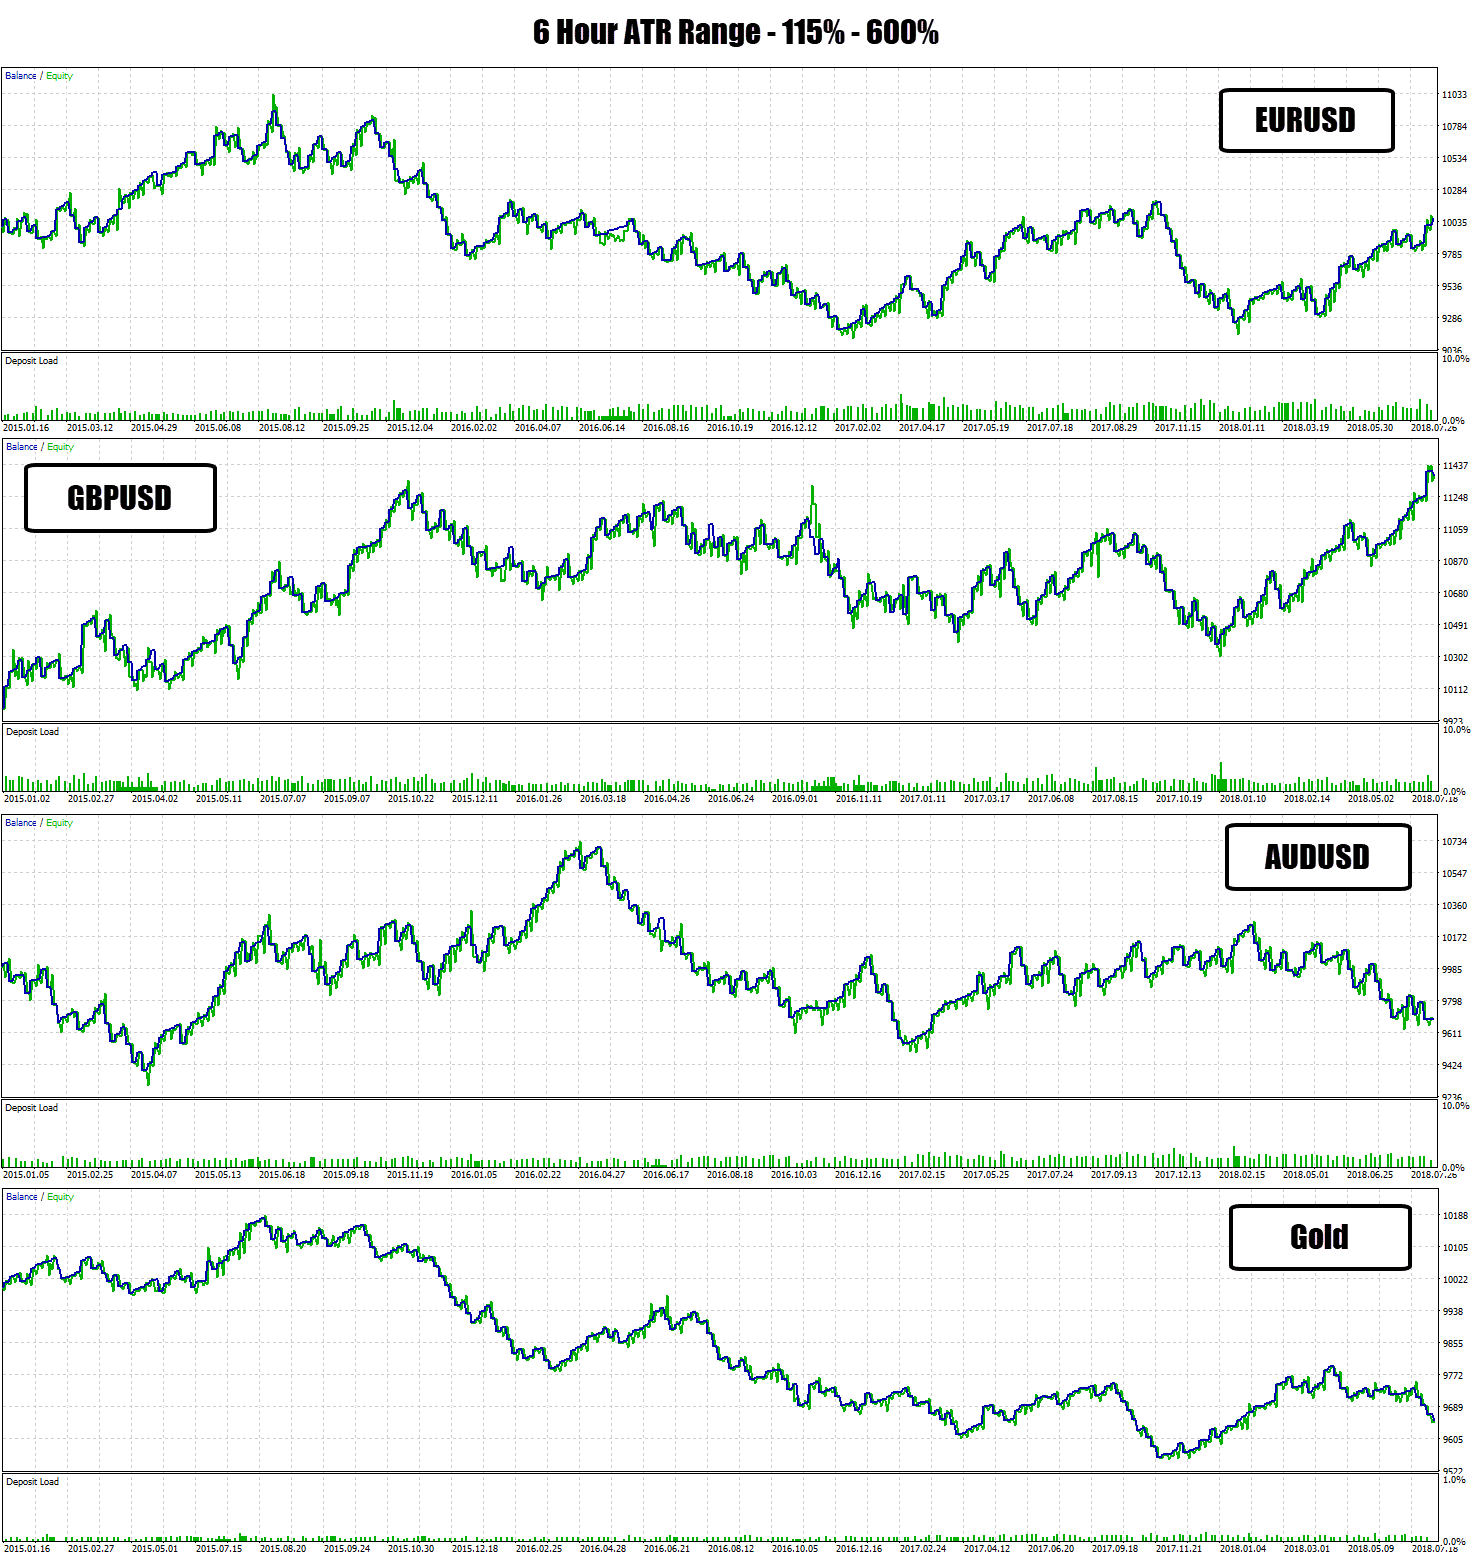
Sideways results as expected, as the performance charts implied this would happen.
None of the bars on the 6 hour data chart really cleared the profitability line, so break even was the best case scenario here.
Moving along to the daily – where I would usually expect cleaner results…
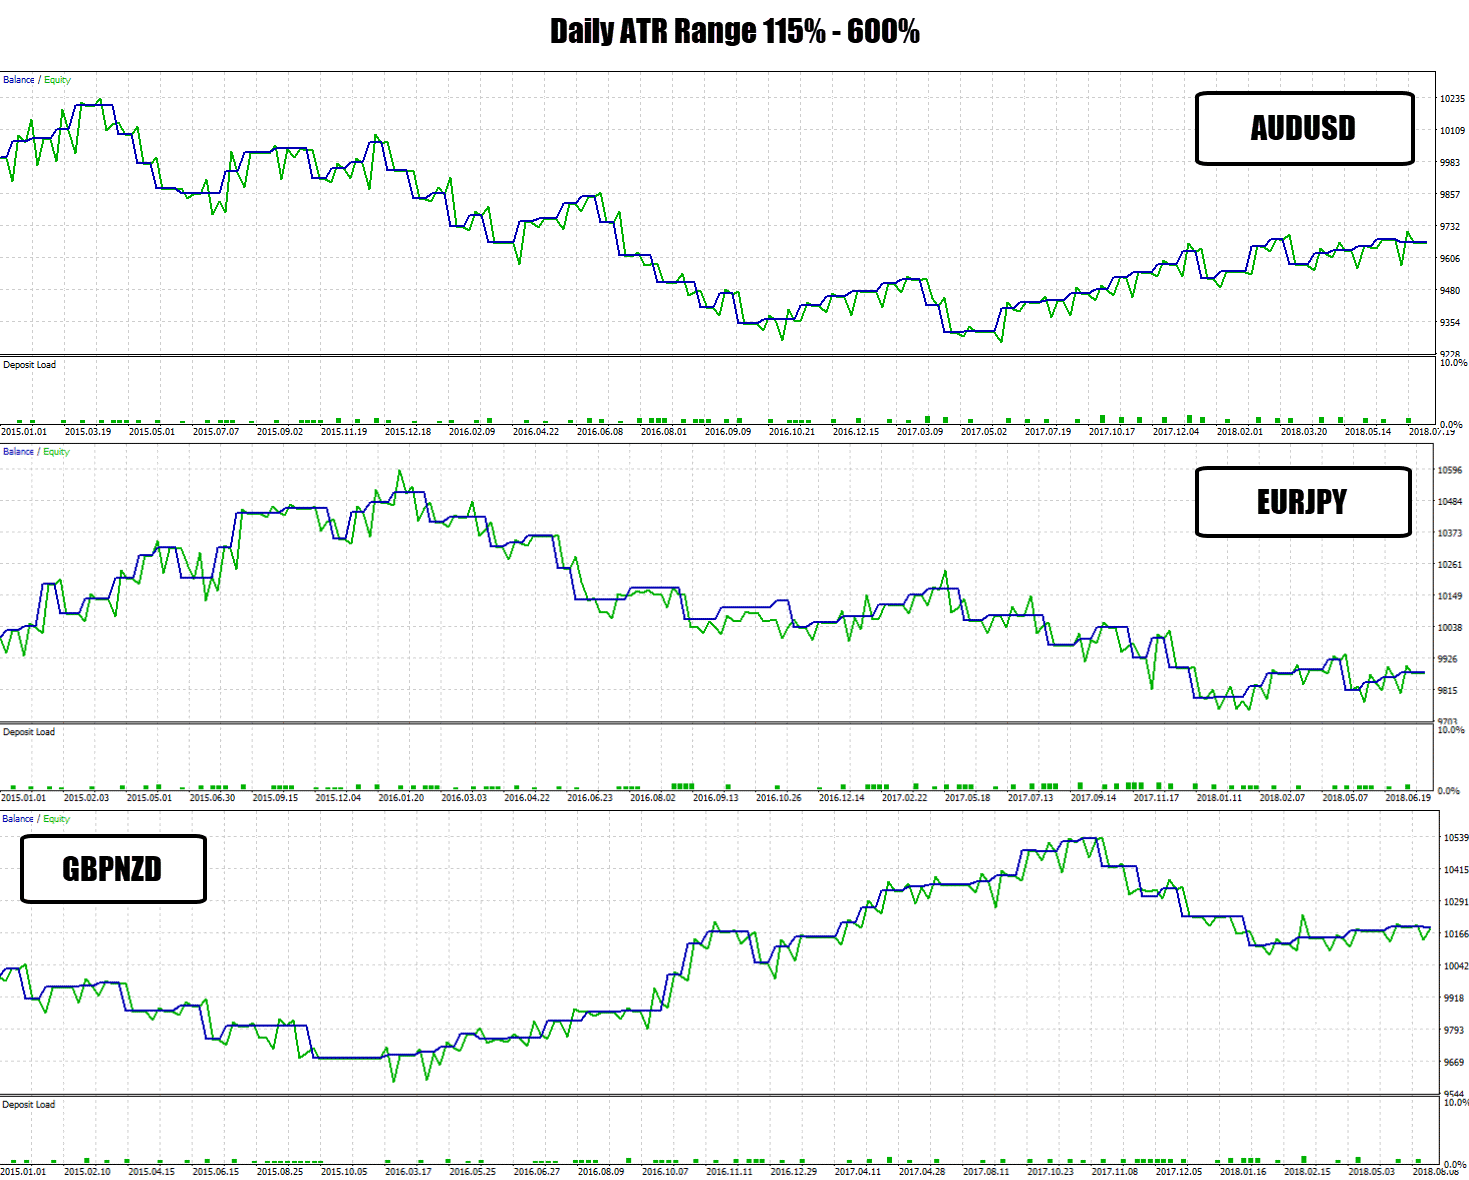
The daily results were the most stable so far, but still nothing to get excited about!
However, there was this one…
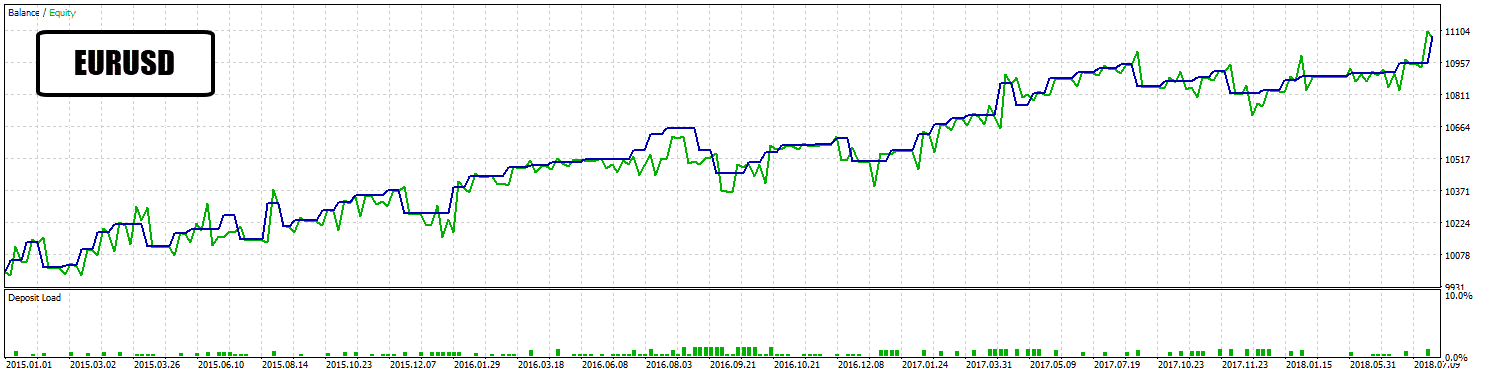
The EURUSD daily output was a pretty damn good equity curve. Just a candle body trader with a min input of 115% makes money 😮 !
Buzzkill: 10% account gain over the 3 year trading period isn’t impressive. Even though it turned a profit – it was a very slow snail system.
So what can we take away here…?
Checkpoint
One clear correlation in the data is the larger the candle body size, the higher chance we get to a trade success condition (a higher or lower close).
Although we have high win rates, the reward output is so bad for each trade, we can’t get over that profitability threshold – causing stop outs in the system to be so destructive and therefore consuming all rewards + more.
This system is not viable with these very simple rules, even though the special case of EURUSD made a profit, it was still a very slow crawl with a few 6 month periods of no profits.
Introducing Moving Average Filters To A Candlestick Pattern Strategy
 Now that we have established a ‘baseline’ for this experiment, we can try adding filters to see if they improve performance.
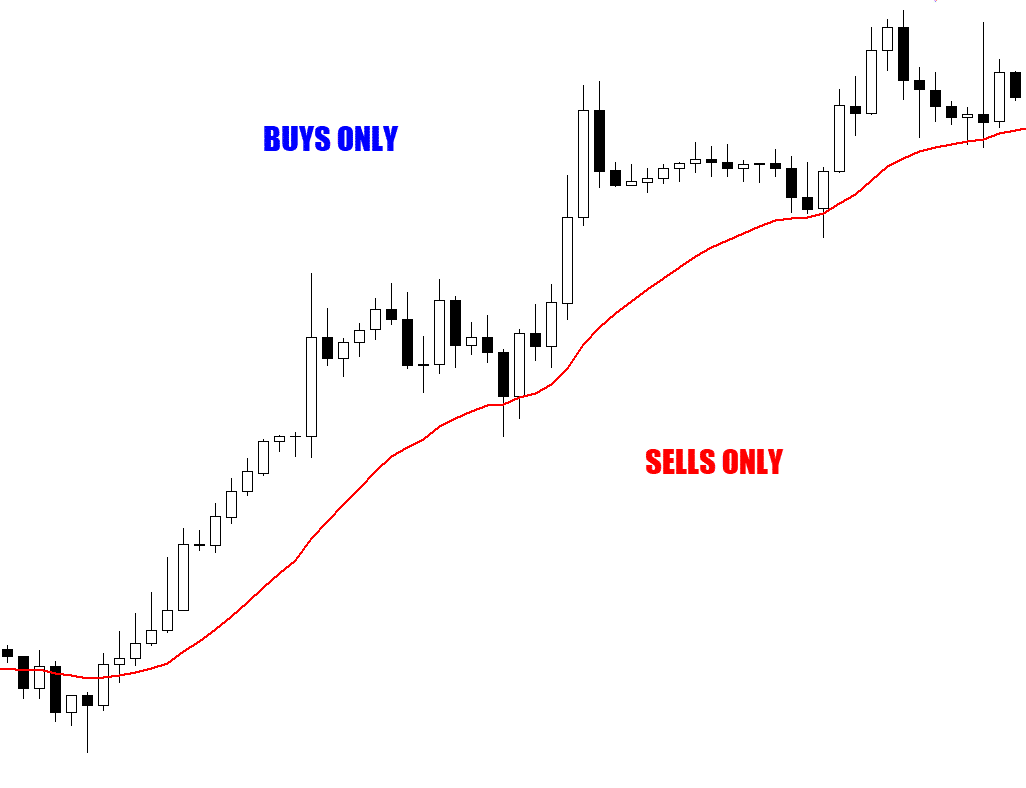
The moving average filter is the ‘go-to’ starter kit for a simple trend filter – attempting to scrub out bad trades, and let the good trades ‘with momentum’ bubble up as quality trade signals.
The simple rules:
- Bullish signals that form above the moving average = pass
- Bearish signals that form below the moving average = pass
- Anything else is filtered out
I collected data on a nice range of exponential moving averages: 10, 20, 33, 50, 65, 100, 200.
I built a special performance comparison graph to help evaluate how effective the EMA filters are on the system.
The 20 EMA = usually a good medium term momentum filter. I also use it in my day to day trading – so I was interested to see what effect it would have here…
First run is through the 15 min data to output what performance change we would see with the 20 EMA filter added…
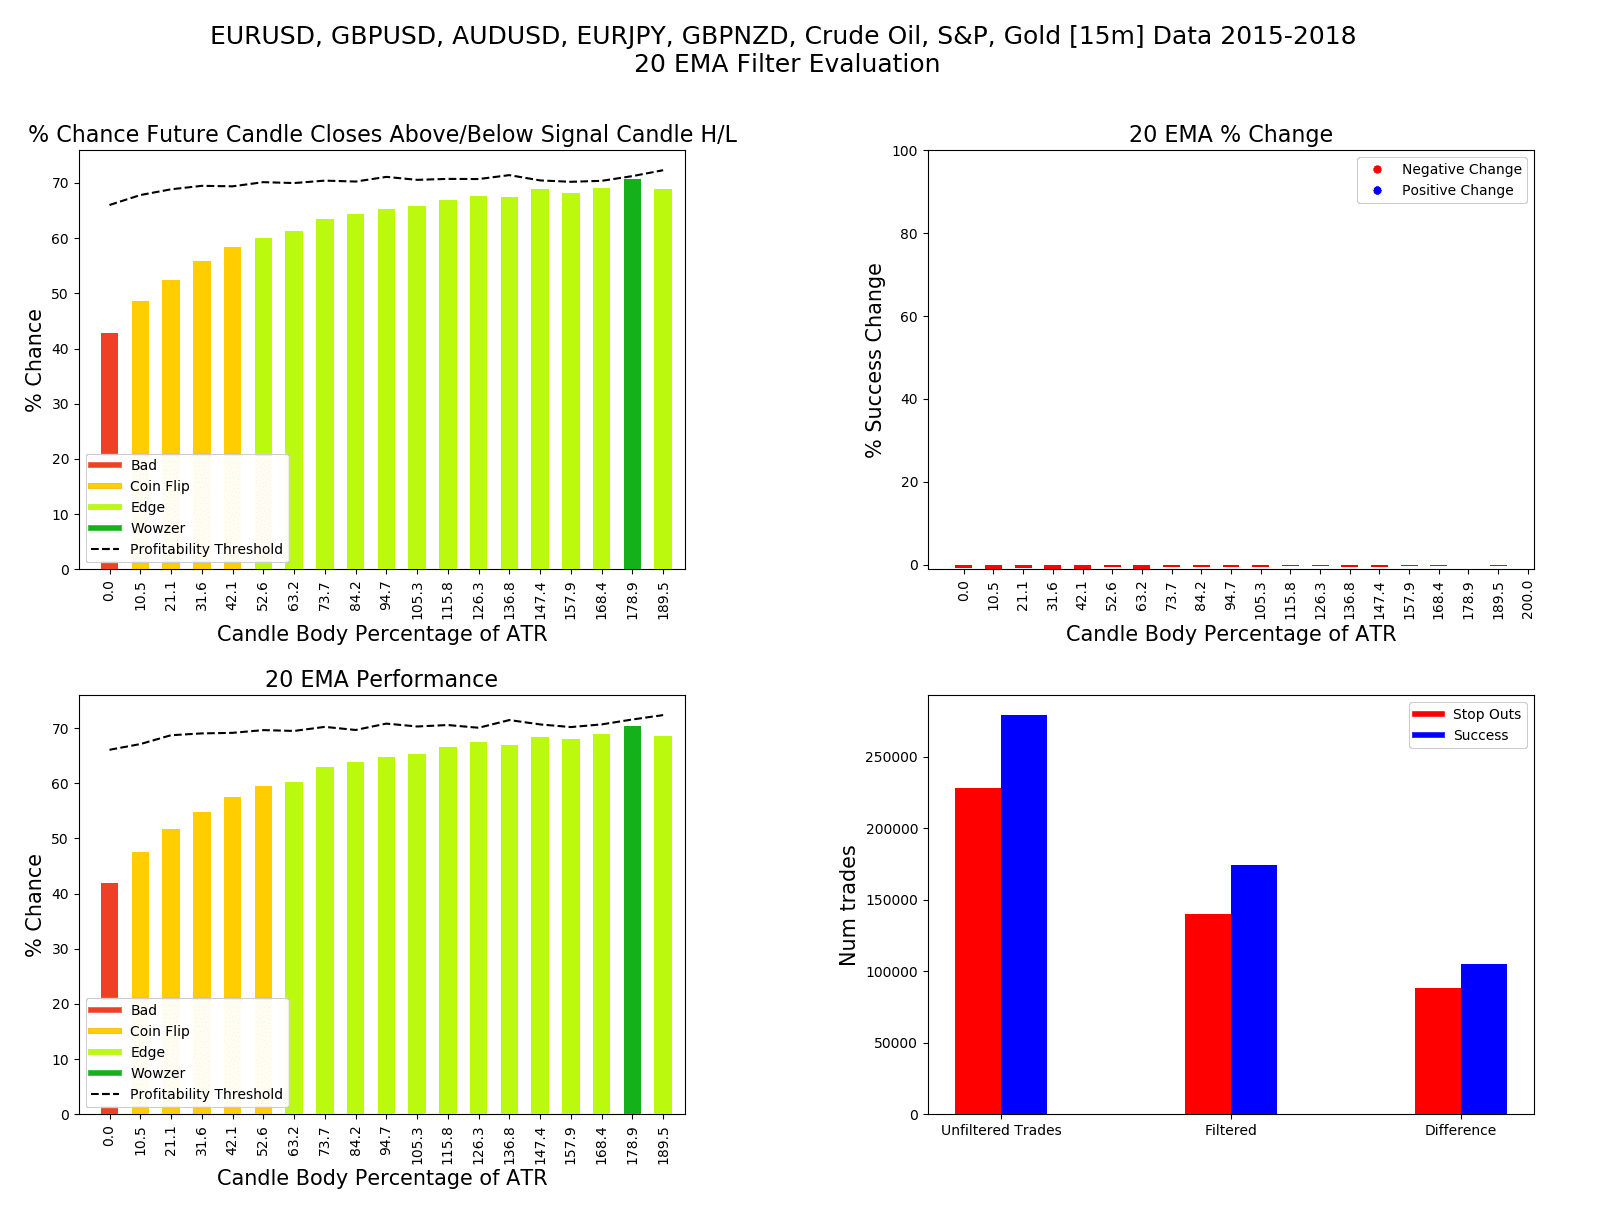
The conclusive graph here is the % Change bar chart in the top right.
This will tell us what effect the filter had on overall performance. In this case, hardly anything.
In fact, those slightly negative red bars, indicate the 20 EMA made the performance slightly worse than the baseline performance.
Let’s run the 8 hour to daily range data…
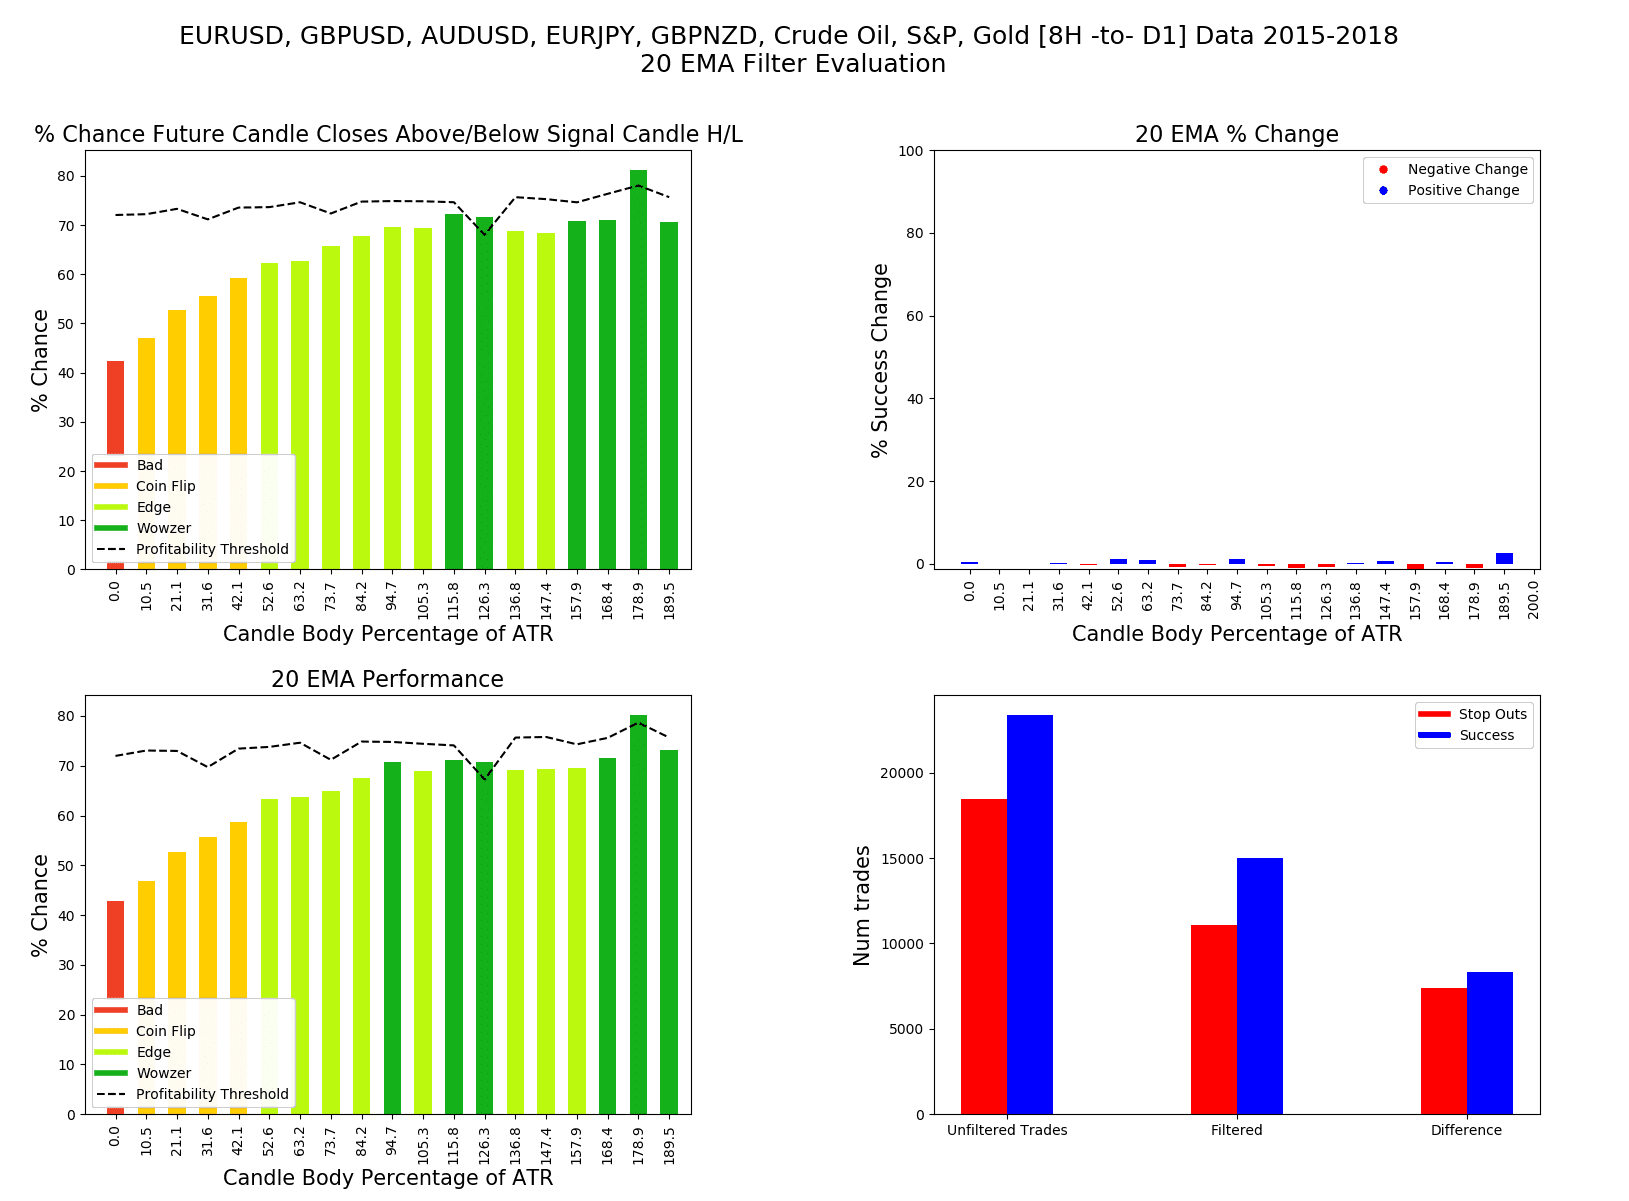
Some tiny bleeps on the radar, but overall a null effect.
This initial data is strongly suggesting the EMA filter does nothing to help the performance of this Forex candlestick strategy.
At this point, I thought it would be too boring to continue with posting individual performance graphs for every single EMA / time frame set.
To get more of a ‘birds eye view’ of how they effect performance, I designed this line graph below which has a lot more bottom line data crammed into one chart.
I only ran the 15 min data test on the GBPUSD as the re-running of the data mining for all these EMAs, for every pair is was too time consuming.
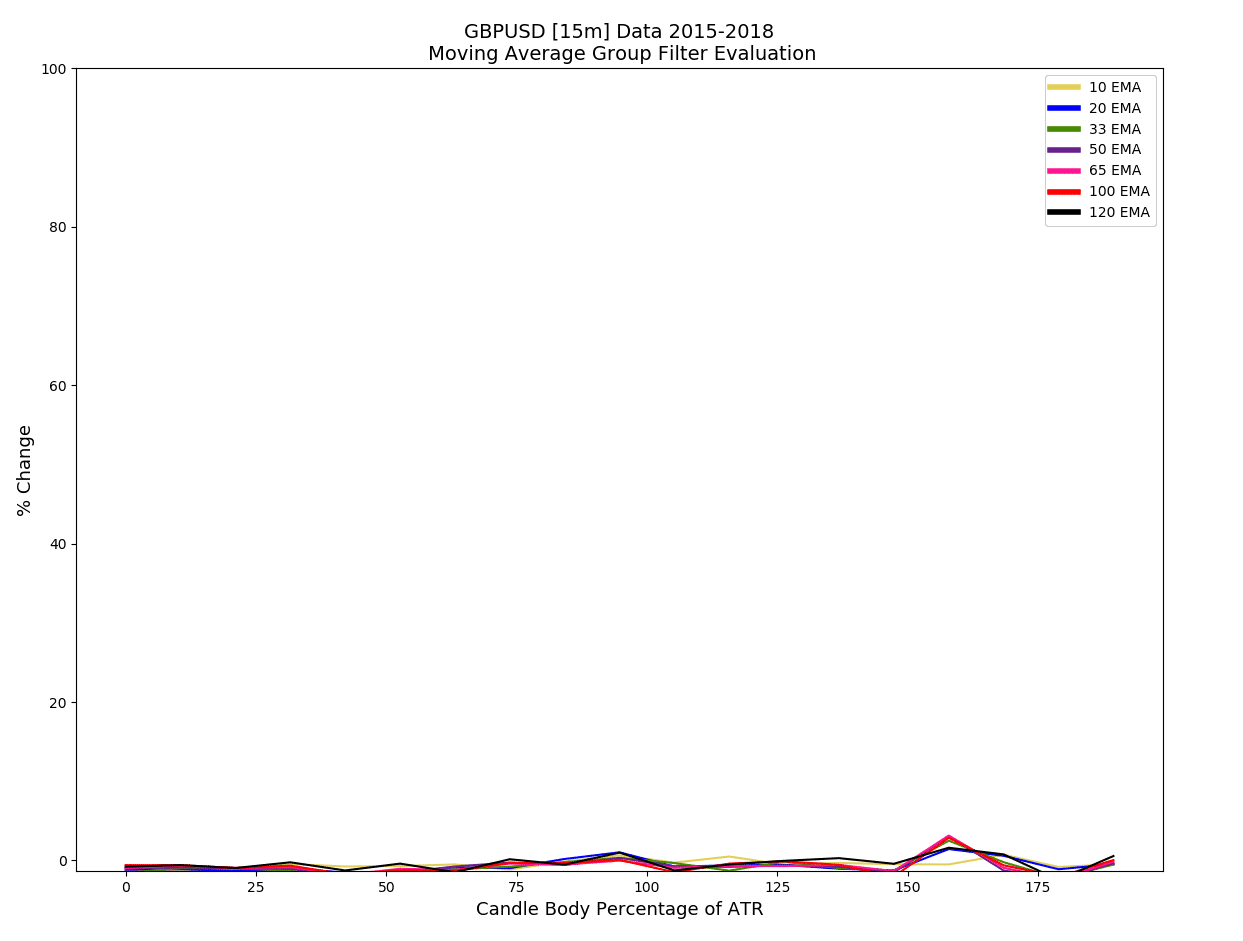
This is a measurement of 0-100 % of how much each EMA boosted, or harmed performance on each EMA period applied.
You can see very quickly there was no response from any of them!
What about on the higher time frames…?
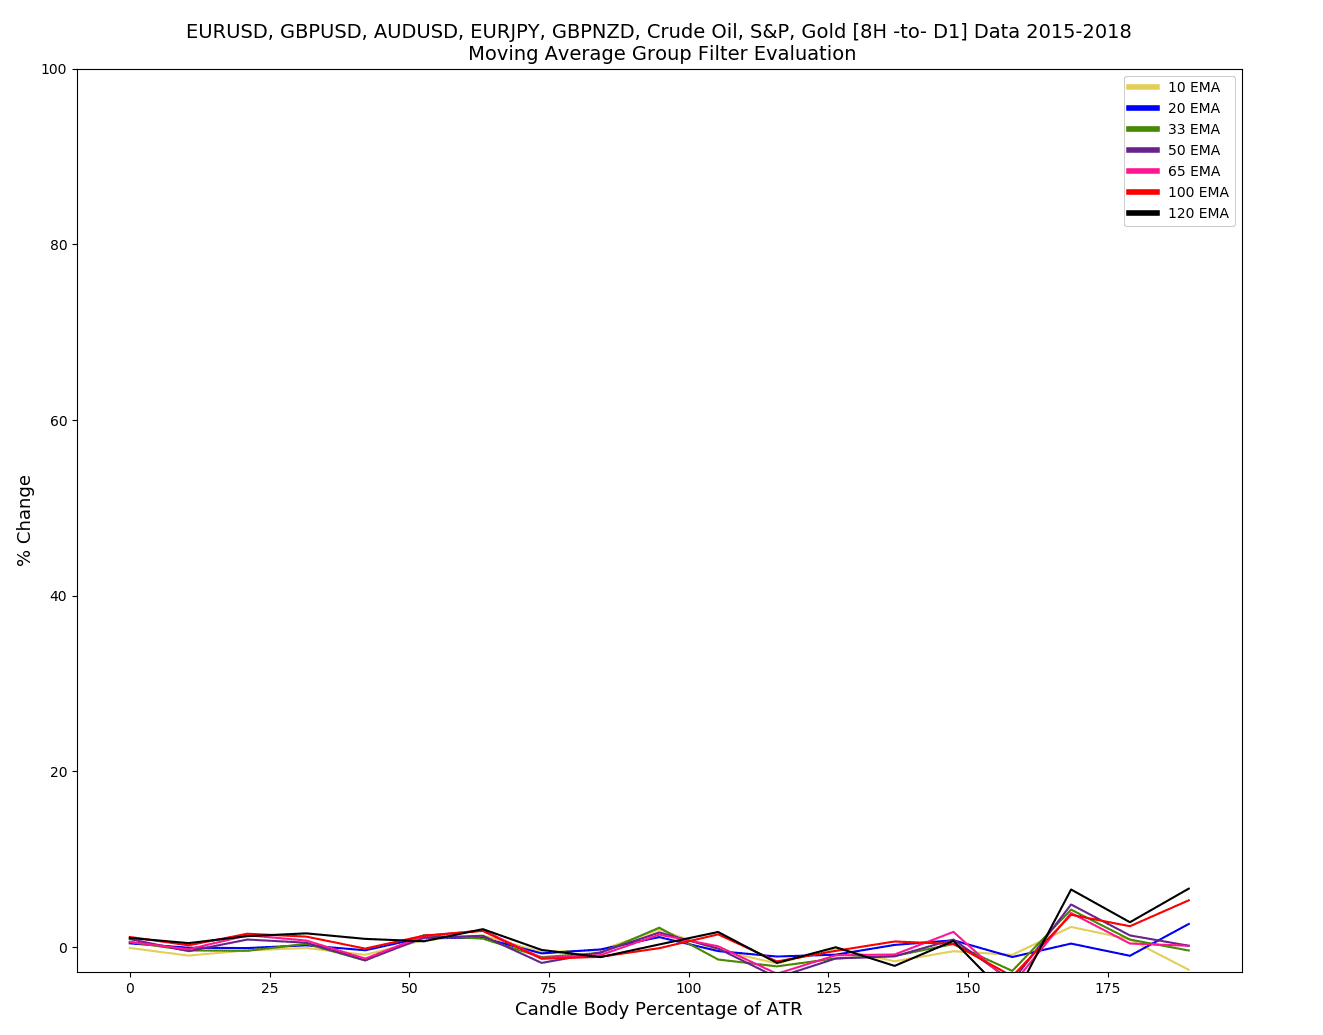
Only some minimal boosts when the body size is over 150% of the ATR.
To be honest I was surprised to see such little effect out of the EMA filters.
This simple approach to trend filtering is used widely in the Forex world – so thinking forward for future tests, it will be very interesting to see if this is even a valid filtering approach at all.
Checkpoint
Surprisingly the exponential moving average’s ‘trend filtering powers’ do nothing to help boost performance in this strategy. We’ve thrown a large range of calculations periods, scaling from short term, medium, and longer term EMAs – but they all having a null effect, some even producing negative results… what!
Candlestick Swing Highest / Lowest Filter
I usually just call this the swing filter.
Basically we want to check the candle’s high or low price to see where it fits within the surrounding candles.
We’re measuring these points to see how many candle highs our signal candle is higher than, or how many lows the signal candle is lower than.
A quick picture to demonstrate…
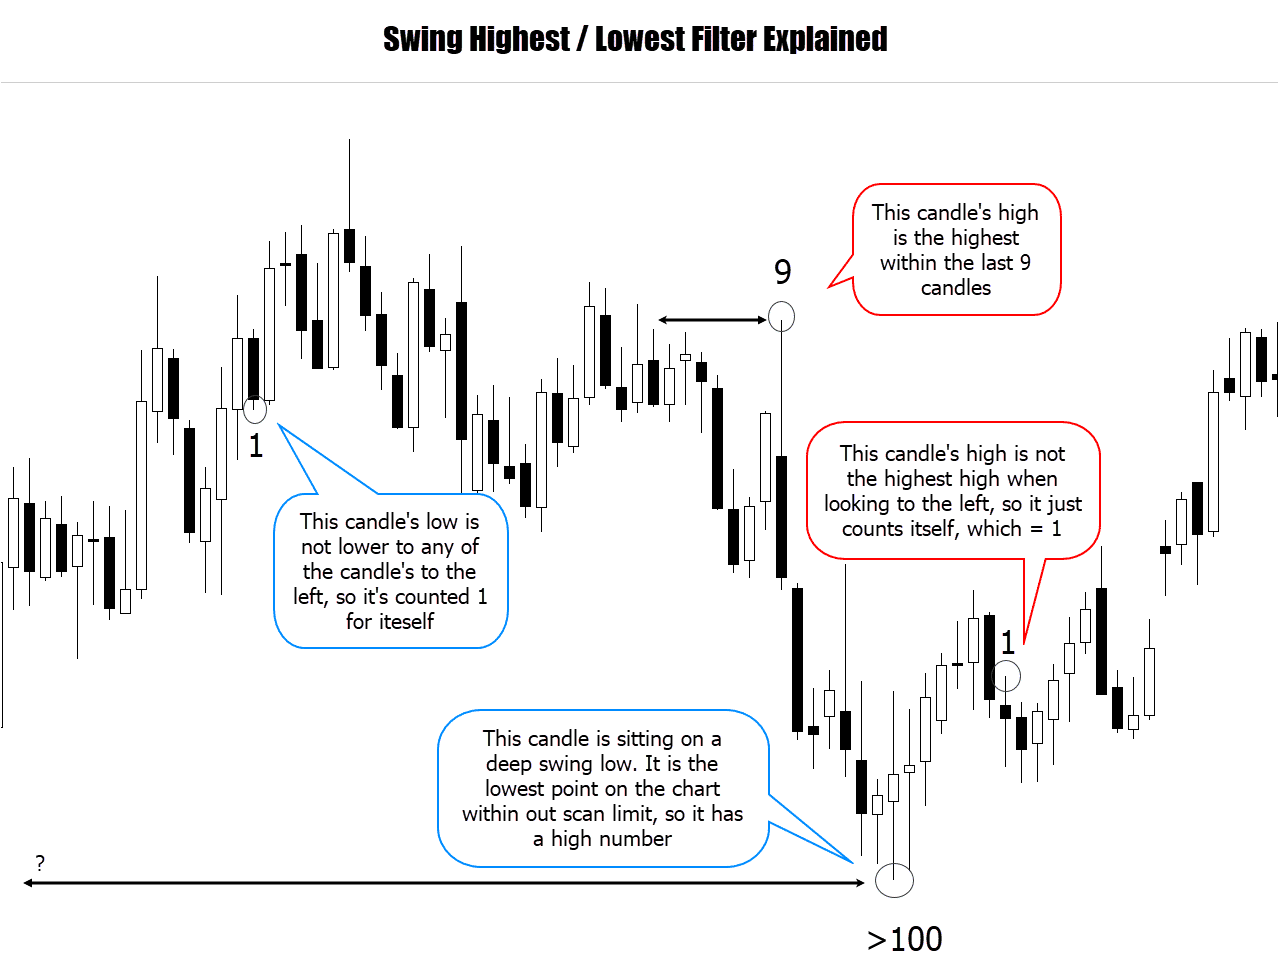
What I am measuring here is if the candle is sitting on a swing high, or swing low – if so, how significant is it?
A measurement of 1 means the candle is not on a swing high or low.
I also measure with these rules:
- If the trade is bullish, measure the swing low significance
- If the trade is bearish, measure the swing high significance
Why? Because I am trying to filter trades sitting on lower highs in a bearish market (after a bullish correction), and in a bullish market, measuring swing lows (after a bearish correction).
For swing traders, this is a valuable measurement.
Generally you would want a swing value of at least 3.
That communicates the candle has the highest high, or lowest low within the last 3 candles.
If we apply a swing filter value of 3 to this system, we get these performance responses…
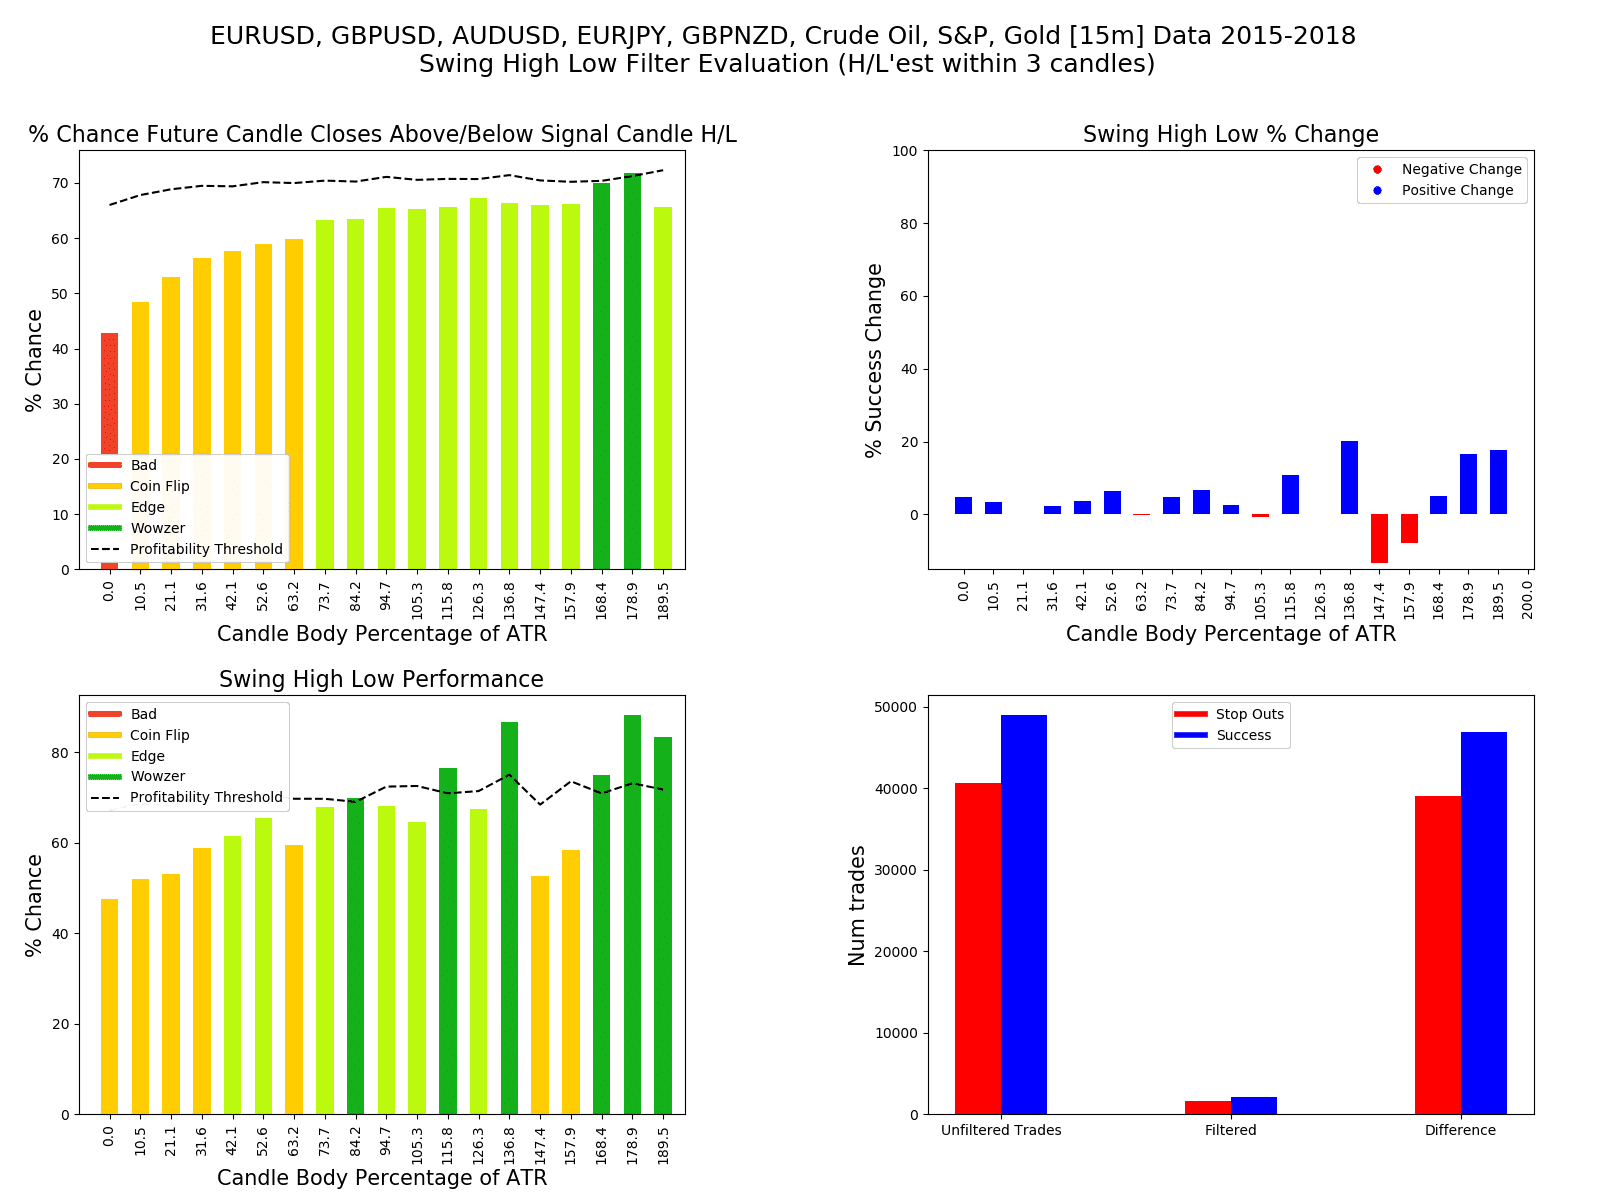
Above is the 15 min data, and how a swing filter of 3 affects the performance.
One striking piece of data that pops out is the number of trades filtered out. The bottom right chart shows how many trades were taken without and with the filter.
So we’re suppressing a lot of trades! It seems to be worth it, look at the chart above it.
We’re getting 10-20% boosts in performance, which leads me onto the performance graphs on the left side.
Top shows the original, bottom shows the performance with the swing filter.
We can see some of the body size ranges pushing performance bars over the profitability line. Curious to see how it looks in a back test…
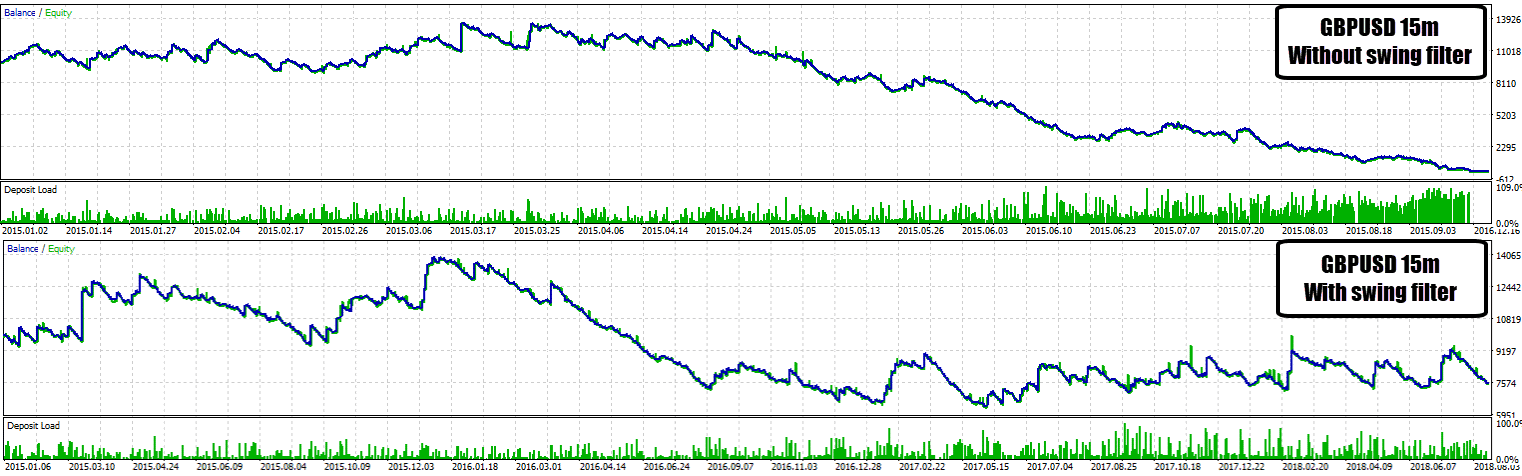
Above is a comparison back test on the GBPUSD 15 min chart.
Without any filters the system tanks pretty quickly, diving the account to $0 over the last part of 2015.
When we add the swing filter, the system doesn’t make us rich – but it does get a massive survival boost, and there is no account meltdown!
A simple swing filter stopped the account diving to $0 and also managed to hold ground until the end of the test period (3 years).
In conclusion the filter is having a dramatic effect on performance, but not enough to crank it into the profitability range.
So what happens when we run it on some higher time frames..?
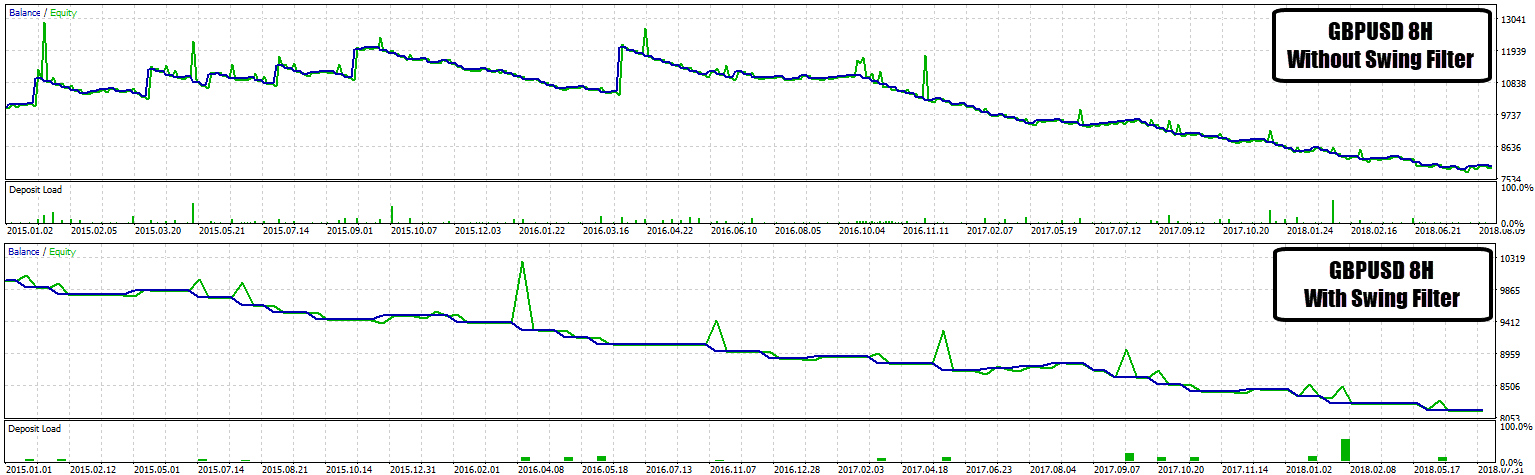
Comparing with and without filter tests on the GBPUSD doesn’t show anything impressive at all.
In fact the filter seems too strong in this context, with the filtered back test only taking a total of about 30 trades over the 3 year period.
The other higher time frames displayed similar results.
Checkpoint
The Swing Filter showed massive filtering effects in the lower time frame tests, but on the higher time frames it filtered out the signals too heavily. This could be because this candle body signal system is not producing any high quality trades to begin with, so the swing filter scrubs out almost all of the signals. I believe the swing filter has a lot of potential, but not in the context of a system packing an extremely bad baseline (unfiltered), performance .
Conclusions for this Forex Candle Strategy
 This Forex candlestick pattern strategy is probably one of the most simple candlestick strategies you could think of, so my expectations were not high.
The data does show – the larger the candle body size, the more likely a higher, or lower close will follow.
Baseline back tests didn’t produce the ‘holy grail’ equity curve we dream of, but nor did we expect it too.
Throwing some filters on the system and evaluating their performance didn’t produce anything exciting either.
It was surprising to see all moving averages having zero effect on performance though!
That one back test on the EURUSD showed a nice equity curve… so there might be others in there.
I’ve included below a Forex robot for MT4 & 5 designed to trade this strategy – with the ability to customize a lot of the inputs. You might find some other markets which produce interesting results.
For my first strategy analysis, I think I will stamp this strategy ‘not practical’.
If you liked this kind of strategy analysis content, please let me know in the comments – so I know whether to continue publishing more tests!
I have a lot of ideas we can test, but there are 1000’s of strategies out there – so also in the comments below you can also let me know your thoughts on:
- Other mechanical strategies to test
- Trade Filter ideas
Thanks very much and look forward to reading your feedback.
Best of luck on the charts!


